
XRP price slips despite 10-day ETF inflow streak: is a breakout still coming?

AI Sentiment: 72/100 Bullish
This score is generated through AI-driven analysis of the article's content.

powered by

Buy XRP (spot) around $1.35–$1.38. The thesis is simple: 10 straight days of spot XRP ETF inflows are shrinking sell-side supply, and XRP is holding above the 200-day EMA (~$1.35), keeping the trend constructive. Momentum is cooling (RSI ~44), which often sets up a cleaner push once inflows persist. Upside target: $1.90 resistance; next support to defend: $1.30, then $1.21.
Key Risk: A daily close below the 200-day EMA (~$1.35) that coincides with ETF inflows stopping or reversing.
Sell/hedge upside risk by buying put spreads on XRP (e.g., 1–3 month $1.30/$1.20 puts) while targeting a breakout. Rationale: price is underperforming and MACD has slipped negative—so the first leg higher can fail at $1.90. The ETF flow supports the base case, but this trade monetizes a likely “breakout attempt then pullback” path.
Key Risk: XRP cleanly breaks and holds above $1.90 with continued ETF inflows, making the pullback thesis wrong.
- Spot XRP ETFs attracted $5.64 million on Monday, extending their inflow streak.
- Weekly XRP ETF inflows exceeded $110M, their highest level since early December.
- XRP must hold its 200-day EMA at $1.35 to maintain its near-term bullish outlook,
Ripple’s XRP remains in the red on Tuesday after rebounding slightly during the previous session.
The altcoin experienced a double-digit correction last week, but improving fundamentals could support a more sustained recovery.
XRP continues to attract institutional capital through spot exchange-traded funds, with technical indicators suggesting a rally for the altcoin in the near term.
XRP ETFs extend inflow streak to 10 days
Bitcoin and other major cryptocurrencies are slightly in the red following the massive rally last week. The leading cryptocurrency is down by less than 1% and has dropped below $78,000.
XRP is also underperforming at the moment, down by nearly 1% since Monday. However, institutional demand for XRP remains resilient despite the cryptocurrency’s recent correction.
According to CoinGlass, spot XRP ETFs recorded $5.64 million in net inflows on Monday. That extended the products’ positive streak to 10 consecutive trading days since August 18.
Weekly net inflows exceeded $110 million last week, representing the strongest weekly performance since early December 2025.
Continued inflows could reduce available market supply and strengthen demand for XRP. A further acceleration in institutional investment would provide additional support for the token’s recovery.
XRP technical outlook: XRP holds above the 200-day EMA
The XRP/USD 4-hour chart remains bullish and efficient despite the broader crypto market consolidating over the past few days.
XRP is currently trading around $1.36 on Tuesday, maintaining a cautiously bullish near-term outlook by remaining above several important exponential moving averages.
The 200-day EMA at $1.35 is the most immediate technical support. The 50-day and 100-day EMAs are both positioned near $1.21, reinforcing the broader demand zone below the current price.
Holding above these moving averages suggests that XRP’s underlying trend remains constructive despite its recent decline from overbought conditions.
The Relative Strength Index has fallen to 44, below the neutral level, after previously reaching extreme levels. Although the decline indicates fading buying pressure, the indicator remains above its neutral midpoint and does not yet signal a bearish reversal.
The Moving Average Convergence Divergence indicator has moved slightly into negative territory.
This suggests that upside momentum is weakening, but the broader outlook could remain positive as long as XRP holds above its 200-day EMA.
If buying pressure strengthens, XRP could target the horizontal resistance level at $1.90.
Sellers may become more active around this area, making it the next major obstacle to an extended rally.
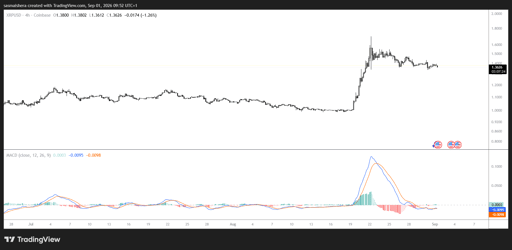
On the downside, immediate support sits at the 200-day EMA near $1.35. A daily close below this level could expose the horizontal support at $1.30.
A deeper correction would bring the 50-day and 100-day EMAs near $1.21 into focus. Below that zone, $1.00 represents the next major structural support level.
XRP’s ability to defend $1.35, combined with continued ETF inflows, will likely determine whether its current rebound develops into a broader recovery.

Bitcoin price rises, but why is $80K proving so hard to break?

HYPE price near all-time high: could Hyperliquid's US entry spark $100?

Strategy (MSTR) stock gains after resuming Bitcoin purchases after 10 weeks

Ethereum price holds near $2,450 despite Fed pressure: Is $2,500 next?

Why is Bitcoin price down today?
No results found
Loading articles...
Failed to load articles. Please try again.