Is XLM preparing to rally to $0.182 amid mixed market sentiments?

AI Sentiment: 62/100 Bullish
This score is generated through AI-driven analysis of the article's content.
powered by
Buy Stellar (XLM) spot targeting $0.164–$0.165 first, then $0.181, with upside to $0.1822 if a daily close clears the 50-day EMA/failed trendline break. Rationale: RSI 57 and MACD near zero show bearish momentum fading; OI rising with positive OI-weighted funding (longs paying shorts) signals improving demand; whale orders under mostly neutral conditions supports a squeeze higher. Key trigger is a firm close above $0.165 to confirm momentum continuation.
Key Risk: A daily close back below $0.165 that flips funding/OI back bearish and drags XLM to retest $0.149 (or lower).
Buy XRP versus XLM (long XRP, short XLM) into the same cross-border bid. Rationale: the article frames both as similar, but XLM is the one showing the clearest technical overhead ($0.164/$0.165) and mixed positioning (long-to-short 0.89, funding only slightly positive). If the market’s “slight bullish tilt” plays out, XRP should outperform on any XLM failure to clear resistance, while still benefiting from the broader crypto cross-border momentum.
Key Risk: XLM cleanly breaks and holds above $0.165 and runs to $0.181–$0.1822, causing XRP to lag and forcing the relative trade against you.
- XLM is up 3% and is now approaching the $0.158 resistance level.
- The rally comes amid improved derivatives data and market sentiment.
- XLM could extend rally towards the $0.1822 if the market recovery continues.
Ripple (XRP) and Stellar (XLM) are cross-border coins, and their performances have been similar in recent weeks.
XLM has been consolidating around the $0.150 region since the start of the month. The coin is up by more than 3% in the last 24 hours and could be preparing to rally to the $0.1822 swing high in the near to medium term.
On-chain and derivatives metrics for XLM reflect mixed market sentiment with a slight bullish tilt. Meanwhile, a firm close above the key technical resistances could set the stage for a potential breakout in XLM if buying momentum strengthens.
Mixed sentiment with a slight bullish bias
CryptoQuant summary data indicates a slight bullish outlook for XLM. XLM’s spot and futures markets show large whale orders under mostly neutral conditions across other metrics, suggesting a bullish outlook.
The derivatives data also suggest that the buyers are slowly regaining control of the market. CoinGlass’ long-to-short ratio for XLM reads 0.89. This ratio, being below one, reflects bearish sentiment in the market, as more traders are betting on the asset’s price to fall.
Meanwhile, the funding rates support improving sentiment. CoinGlass’ OI-Weighted Funding Rate data for Stellar flipped positive on Monday, reading 0.0035% on Tuesday. This positive rate indicates that longs are paying shorts and projecting a bullish sentiment.
This combination suggests indecision among Stellar investors with a mid-bullish bias, which limits the chances of a sustained recovery.
The futures Open Interest (OI) currently reads $94.16 million, higher than the $85 million recorded on Monday. The increase in OI suggests fresh capital entering the Stellar ecosystem, with most traders opening long positions.
XLM technical outlook: XLM approaches the $0.1588 resistance
Similar to XRP, the XLM 4-hour chart is bearish and efficient. At press time, XLM is trading at $0.156 after rebounding by over 4% the previous day.
XLM is currently holding in a bearish configuration below the 50-day, 100-day, and 200-day EMAs at $0.164, $0.181, and $0.215, respectively. The failed break of the descending trendline, with its break level now at $0.165, reinforces overhead pressure.
The momentum indicators are showing signs that the buyers are regaining control. The RSI of 57 is above the neutral 50, indicating a fading bearish momentum. The MACD lines are also near the zero region, hinting at a declining downside momentum.
If the market recovery persists, XLM would meet immediate resistance around the 50-day EMA at $0.164 and the former descending trendline break level at $0.165.
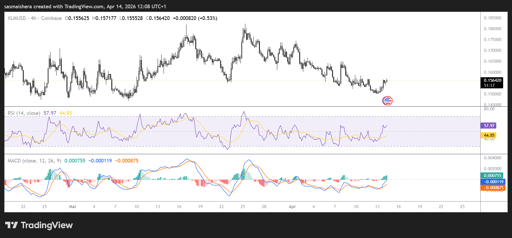
A daily close above these levels would be needed to ease immediate pressure. The next major resistance would be met at the 100-day EMA near $0.181, followed by the 23.6% Fibonacci retracement of the broader downswing at $0.201 and the 200-day EMA at $0.215.
However, if the market undergoes a correction following yesterday’s rally, XLM could retest the Sunday low of $0.149. The next major support level sits at $0.136, where buyers would be expected to defend the broader base if selling resumes.

Injective price forecast: Coinbase integration strengthens bullish case for INJ

Bitcoin price outlook: treasury sell-offs, Poolin bankruptcy and $1.2B options expiry

How high can BEAT go as whale withdrawals drain exchange supply?

ONDO price jumps 10%: did FINRA just unlock its biggest US opportunity?

TRX tests $0.33 resistance: is Tron's gasless payment boom enough?
No results found
Loading articles...
Failed to load articles. Please try again.