Hang Seng index flashes risky patterns as China economic growth falters

AI Sentiment: 18/100 Bearish
This score is generated through AI-driven analysis of the article's content.
powered by
Sell Hang Seng exposure via iShares Hang Seng Index ETF (02800.HK) or a HSI futures short. Weak May data (retail down, fixed asset investment down, house prices down) plus bearish chart setup (death cross risk + head-and-shoulders below neckline) points to continued downside toward H$23,000 support.
Key Risk: China announces a fast, credible demand/credit stimulus that flips growth expectations and forces a technical reversal above the neckline/50-day.
Short Xiaomi (1810.HK) and Trip.com (9961.HK). The article flags tech as the Hang Seng drag, with Xiaomi hit by memory-chip margin pressure and Trip.com pressured by Beijing’s investigation. If growth stays weak, discretionary travel and margin-sensitive hardware/software names keep underperforming versus global AI winners.
Key Risk: Regulators ease pressure and earnings stabilize (chip/memory pricing rebounds or investigation outcomes turn benign), triggering a sharp rerating.
- The Hang Seng Index retreated after the weak Chinese data.
- It is about to form a death cross pattern, a common bearish sign.
- The index also formed a head-and-shoulders chart pattern.
The Hang Seng Index retreated on Tuesday and remained in a correction after China released a weak economic report. It retreated to H$24,507, down by over 12% from the year-to-date high of H$28,050.
Hong Kong stocks have largely diverged from their global peers, with the South Korean Kospi and Japan’s Nikkei 225 rising to their record highs amid the AI boom.
Hang Seng Index slips after weak China data
Hong Kong shares retreated after a report showed that the Chinese economy weakened in May this year. A report by the country’s statistics agency showed that the house price index retreated by 3.5% in May.
Retail sales dropped by 0.6% in May after rising by 0.2% in the previous month. This retreat was notable as it was the first consumer spending drop since the Covid pandemic.
More data showed that fixed asset investment retreated by 4.1% this year, worse than the expected retreat of 2%. These numbers mean that growth may remain under pressure in the near term.
Still, on the positive side, recent data showed that trade continued doing well in May. Exports jumped by 19.4% in May to over $376 billion, while imports slowed to $271 billion. These numbers showed that the trade surplus continued doing well. Another notable piece of data showed that foreign direct investment (FDI) rose to $40 billion in the first four months of the year.
Chinese technology stocks have dragged the Hang Seng
Most Hang Seng companies have retreated sharply this year. Technology companies have, in particular, been among the top laggards. Trip.com, which offers the biggest travel portal in the country, has plunged by 36% this year after Beijing launched a major investigation.
Xiaomi, China’s equivalent to Apple, has also plunged by 34% this year. This retreat occurred even as its top competitors, such as Samsung and Apple, surged to record highs. It has lagged because of the ongoing memory chip price surge, which has affected its margins.
Kuaishou Technology stock has slipped by 30.65%, while Meituan, Tencent, and Alibaba have all plunged by over 25% this year.
The other top laggards in the Hang Seng Index are companies like ENN Energy Holdings, JD Health, Shenzhou International, Sands China, and Laopu Gold.
On the other hand, the top gainers in the index include Lenovo Group, Contemporary Amperex, Techtronic Industries, CK Hutchison, and China Resources Land.
HSI technical analysis
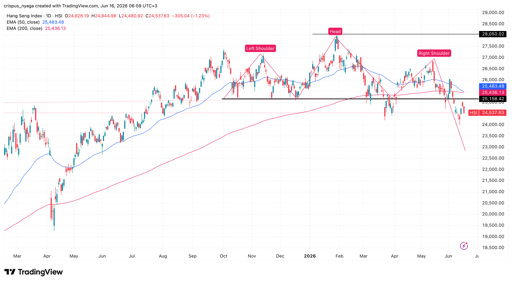
Hang Seng Index chart | Source: TradingView
Technical analysis suggests that the Hang Seng Index has come under pressure in the past few months. It has slumped from a high of H$28,050 in January to the current H$24,530.
Sadly, the index has formed two crucial risky chart patterns. It is about to form a death cross pattern as the 50-day and 200-day moving averages have crossed each other. A death cross is one of the riskiest patterns in technical analysis.
The index has also formed a head-and-shoulders pattern and is now below the neckline. Therefore, there is a risk that it keeps falling in the near term, potentially to the next key support at H$23,000.

Here’s why the Uber stock price is in a free fall

Here’s why flying car stocks like Joby and Archer Aviation falling

Alphabet, Tesla earnings set a nervous tone: all eyes on Meta, Amazon and Microsoft

Adani and other Indian power stocks rally on AI play, but are valuations too high?

Why are Nvidia-backed CoreWeave, Nebius, and IREN stocks plunging?
No results found
Loading articles...
Failed to load articles. Please try again.