GBP/USD bears regain control after weak UK house price index

- The GBP/USD pair declined after the relatively weak UK house price index.
- House prices declined in June as the government started winding down the stamp duty waiver.
- The pair will next react to the latest FOMC minutes.
The GBP/USD price is under pressure after the relatively soft UK House Price Index (HPI) data. The pair dropped to 1.3795, which was about 0.77% below the highest point last week.
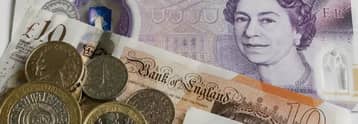
UK house price index
The UK economy has emerged from the pandemic relatively better than expected. This recovery is mostly due to actions by the Bank of England (BOE) and the government. The BOE brought interest rates low while the Boris Johnson administration put measures to support the economy. It has also intensified the rollout of the coronavirus vaccine.
Some of the government’s actions to support the economy were the furlough program and the stamp duty exception. The furlough helped to prevent mass job losses in the country while the stamp duty waiver made it cheaper for people to buy homes.
Subsequently, house prices have risen in the past year. The average house price has risen by more than £21,000 in the past 12 months. However, this growth seems to be fading as the government starts winding down the program.
According to Halifax, the average house price in the UK dropped by 0.5% to £260,358. The prices rose by 8.8% on a year-on-year basis. In a statement, Russel Galley of Halifax said:
“However, we would still expect annual growth to have slowed somewhat more by the end of the year, with unemployment expected to edge higher as job support measures unwind, and the peak of buyer demand now likely to have passed.”
The GBP/USD will later react to the latest FOMC minutes that will come out later today. The minutes are expected to provide more colour on the committee’s thinking when it made its recent interest rate decision. They will be released at a time when US bond yields have declined to the lowest level in more than four months.
GBP/USD analysis

The daily chart shows that the GBP/USD pair broke out below the lower side of the rising wedge pattern last month. Since then, the pair has moved below the 50-day wolume-weighted moving average (VWMA) indicator, which is usually a bearish signal. Additionally, the MACD indicator has moved below the neutral line, which is usually a bearish signal.
Therefore, since there is no other major domestic catalyst for the sterling, the least resistance to the downside is the path of least resistance. This is in line with what analysts at ING wrote:
“Ahead of a speech by Andrew Bailey and some industrial output data on Friday, GBP is left without other domestic drivers, and Cable may follow EUR/USD lower today, making a more decisive move below 1.3800.”

US dollar tumbles as Iran peace deal sparks massive global risk rally
Sterling holds firm despite economic weakness and political uncertainty

US dollar steadies as Iran peace hopes and Fed rate risks jolt FX markets
Dollar holds ground as investors await ECB policy announcement

EUR/GBP forecast: rare chart pattern points to a crash after ECB decision
No results found
Loading articles...
Failed to load articles. Please try again.