XRP could dip below $1.4 despite increased ETF inflow

- XRP is down 2.5% as the broader market dips.
- The bearish performance comes despite the institutional and retail interest.
- XRP could retest the Thursday low of $1.33.
The cryptocurrency market has turned bearish after an excellent performance over the weekend.
Bitcoin has dropped below $68k again, while Ether is struggling below $2k.
XRP, the fourth-largest cryptocurrency by market cap, is down by 2.5%, making it the second-worst performer among the top 10 cryptocurrencies.
At press time, XRP is trading at the $1.45 support level and could dip lower if the bearish trend persists.
XRP stays below $1.5 despite modest institutional and retail interest
XRP has maintained its fourth place in the cryptocurrency market despite losing 2.5% of its value over the past few hours.
Its performance comes despite XRP's digital investment products recording inflows last week, outpacing other leading assets such as Bitcoin (BTC) and Ethereum (ETH).
Data obtained from CoinShares shows that the products saw net total inflows of around $33.4 million in the week through to Friday.
This brings the cumulative assets under management (AUM) to $2.55 billion.
This is higher than Bitcoin and Ethereum, which recorded outflows totalling $133.3 million and $85.1 million, respectively.
Outflows across the board totalled $173 million last week.
XRP could benefit from this condition as steady inflows support positive market sentiment, increasing the odds of a sustainable price rebound.
The derivatives market has also benefited from increased retail participation in recent days.
According to CoinGlass, the futures Open Interest (OI) on Tuesday stands at $2.50 billion, similar to what was recorded on Monday.
Retail interest has steadied since Friday, with the OI averaging at $2.26 billion over the past five days.
If the OI increases, it could improve sentiment surrounding the token and stop the price decline.
XRP holds above $1.4 amid price volatility
Similar to Bitcoin and Ether, XRP’s 4-hour chart against the USD is bearish and efficient.
It is currently trading at $1.45, below its 50-day Exponential Moving Average (EMA) at $1.73, 100-day EMA at $1.94, and 200-day EMA at $2.14.
These averages serve as strong resistance points for XRP.
XRP’s technical indicators have improved in recent days, and this could boost its price in the near term.
The Moving Average Convergence Divergence (MACD) line on the 4-hour chart has crossed above the signal line, with the green histogram bars expanding in support of a short-term bullish outlook.
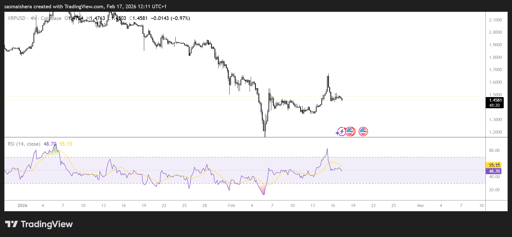
Furthermore, the Relative Strength Index (RSI) stands at 55 and edges higher on the same chart, indicating a growing bullish momentum.
If the bulls push higher and XRP’s price closes above the $1.73 resistance, it could surge higher towards the $1.94 (100-day EMA) region and ease the selling pressure.
However, failure to increase the buying momentum could see XRP lose the $1.45 support level and dip towards the Thursday low of $1.33.

Crypto Market News This Week: Top Catalysts for BTC and Altcoins

Cardano price forecast: can ADA rally past $0.20 after Iran deal?

H token rebounds after exploit, but can it reclaim the $0.80 mark?

What’s next for Bitcoin as US and Iran are set to sign peace deal?

HYPE crypto price prediction as Hyperliquid volume, ETF inflows jump
No results found
Loading articles...
Failed to load articles. Please try again.