XRP stuck at $1.40: will bulls break key resistance or fade again?

AI Sentiment: 42/100 Bearish
This score is generated through AI-driven analysis of the article's content.
powered by
Buy XRP at ~$1.40 for a breakout attempt. Setup: derivatives funding flipped slightly positive (bulls paying shorts) while spot conditions look neutral-to-slightly bullish; price is coiling under the 100-day EMA (~$1.50) and channel top (~$1.53). Catalyst is a clean push through $1.50–$1.53, targeting $1.90 next. Key risk: XRP fails to reclaim $1.50 and rolls over, breaking $1.30 and accelerating toward the descending channel lower bound (~$0.72).
Key Risk: Breakdown below $1.30 (thesis flips from “coil for upside” to “trend down resumes”).
Sell/short XRP perps on any rejection at $1.50–$1.53. Setup: 4-hour trend is still bearish and MACD is marginally negative; long-to-short ratio is below 1 (more bears), so rallies into resistance can be sold. Trade for a mean reversion back toward $1.40, then $1.30 if momentum fades. Key risk: a sustained breakout above $1.53 forces shorts to cover and drives price toward $1.90.
Key Risk: Breakout and hold above $1.53 (short squeeze).
- XRP's derivatives data suggests indecision among investors.
- Ripple continues to face major resistance around the 100-day EMA
- The coin could retest the $1.30 support level in the near term.
The cryptocurrency market is having a positive start to the week as Bitcoin and other major coins are in the green.
Bitcoin hit the $81,000 level during the early hours of Tuesday, while Ether is slowly approaching $2,400.
However, XRP, the native coin of the Ripple ecosystem, continues to experience sideways price action.
XRP is trading at $1.40 amid mixed signals from on-chain activity and derivatives positioning that point to a lack of clear directional bias.
On-chain activity shows mild bullish signs
XRP is down by less than 1% in the last 24 hours and is now trading at $1.40 per coin.
The bearish performance comes despite CryptoQuant’s summary data suggesting a neutral to slightly bullish outlook for XRP.
According to CryptoQuant, XRP’s spot markets show cooling conditions and buy-side dominance, with mostly neutral conditions across other metrics.
This suggests a potential upside move in the near term.
The derivatives data indicate that Ripple is showing a mixed market sentiment. CoinGlass’ long-to-short ratio for XRP reads 0.95 on Tuesday.
This ratio, being below one, reflects bearish sentiment in the market, as more traders are betting on the asset’s price to fall.
However, XRP’s funding rates data support improving sentiment. CoinGlass’ OI-Weighted Funding Rate data for XRP flipped positive on Tuesday, reading 0.0015%.
This positive rate indicates that longs are paying shorts and projecting a bullish sentiment.
The above-mentioned combination suggests indecision among XRP investors and a lack of clear directional bias.
The futures Open Interest (OI) stands at $2.57 billion, suggesting that traders have kept their positions open in the market with the expectation of an XRP rally in the near term.
Technical outlook: XRP approaches a key resistance zone
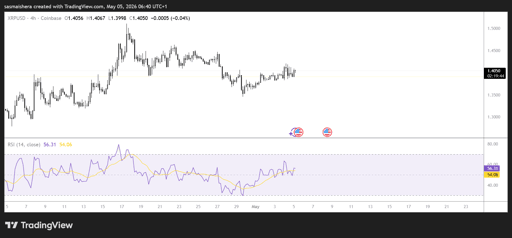
The XRP/USD 4-hour chart is bearish and efficient as Ripple is currently trading at $1.40.
It is currently trading below the 50-day EMA at $1.40, with the 100-day EMA at $1.50 and the 200-day EMA at $1.73.
Trading below these EMAs reinforces a layered topside barrier within a broader downward parallel channel whose upper boundary is near $1.53.
Currently, the momentum indicators remain mixed.
The Relative Strength Index (RSI) on the 4-hour chart is hovering just above the 50 mark while the Moving Average Convergence Divergence (MACD) remains marginally negative, hinting that recovery attempts lack decisive action at the moment.
If the bulls regain control, they would encounter immediate resistance at the 100-day EMA around $1.50, followed by the channel top at $1.53.
A break above these levels would bring the 200-day EMA at $1.73 into focus, and the horizontal barrier at $1.90 define a broader supply zone.
However, if the sideways action or bearish trend persists, XRP would see initial support at the horizontal level of $1.30.
Failure to defend this level could expose the lower boundary of the descending channel near $0.72.
The price action remains choppy at the moment, and investors might stay away until the market has a clear directional bias.

Oobit launches contactless crypto ATM cash withdrawals for users

Flowra partners with Honeypot on validator compliance infrastructure

Why is Injective price going up?

Uniswap price jumps above $4: is a bigger UNI breakout about to explode?

PI network jumps 10%: is a breakout finally taking shape?
No results found
Loading articles...
Failed to load articles. Please try again.