SCHD ETF stock just flashed a rare pattern: here’s why it may surge

AI Sentiment: 78/100 Bullish
This score is generated through AI-driven analysis of the article's content.
powered by
Buy SCHD. The cup-and-handle setup points to a breakout above ~$31.97 with a measured target near $33.60 (then ~$35). It’s also trading at a lower valuation (P/E ~18 vs S&P 500 ~23), and its dividend-growth tilt makes it a clean “AI-bubble hedge” if tech de-rates.
Key Risk: A broad market selloff that drags dividend ETFs down, breaking the chart support around ~$30.25 and invalidating the pattern.
Buy the underlying dividend-growth leaders inside SCHD (e.g., QUALCOMM, Texas Instruments, UnitedHealth, Coca-Cola, Chevron). If SCHD breaks out, inflows typically rotate into the same high-quality, cash-generating names driving the ETF’s index weight—pushing individual stocks higher even if the ETF lags.
Key Risk: Company-specific earnings or guidance shocks (especially in semis/healthcare) that cause investors to sell the constituents even while SCHD holds up.
- SCHD ETF has had a total return of 16% this year, higher than S&P 500’s 8.5%.
- The fund has formed a cup-and-handle pattern on the daily chart.
- This pattern points to more gains in the coming weeks.
The Schwab US Dividend Equity (SCHD) ETF has remained on edge in the past few days and is now hovering near its all-time high of $32.15.
It has soared by 20% in the last 12 months and is about 4% in the last 30 days.
It has slowly formed a highly bullish chart pattern, which may trigger a surge soon.
SCHD ETF stock has formed a cup-and-handle pattern
The daily chart shows that the blue-chip SCHD ETF has bounced back from a low of $30.25 on March 19 to the current $31.78.
It has slowly formed a cup-and-handle pattern whose upper side is at $31.97 and lower side is at $30.25. In most cases, this pattern normally leads to more gains.
The fund is in the process of forming the handle section of the cup-and-handle pattern, which will lead to more gains in the coming days or weeks.
This cup has a depth of $1.70, which is calculated by subtracting $30.25 from the cup's upper side of $32.
Adding $1.70 to the cup’s upper side of $31.97 gives the target of $33.60, which is about 6% from the current level.
A move above that price will point to more gains, possibly to the psychological level of $35.
The bullish SCHD stock outlook is also supported by the 50-day and 25-day Exponential Moving Averages (EMA), which have provided it with substantial support in the past few weeks.
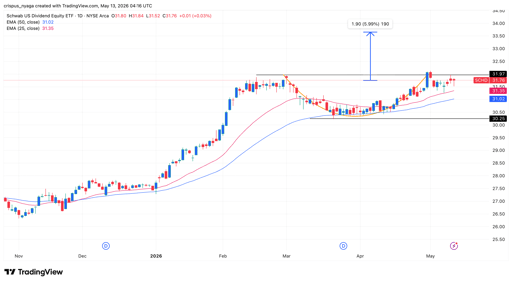
SCHD ETF stock chart | Source: TradingView
Undervalued blue chip ETF to hedge against AI bubble risks
The Schwab US Dividend Equity ETF is one of the most popular funds in the stock market, thanks to its long track record of dividend growth.
It achieves this by investing in companies that have a long track record of hiking their dividends.
At the same time, it is often seen as the anti-AI ETF because it has little exposure to the technology industry.
According to its website, most companies in the fund are in the consumer staples, healthcare, energy, industrials, and technology industries.
The top names in the fund are companies like Qualcomm Technologies, Texas Instruments, United Healthcare, Coca-Cola, Chevron, Merck, Verizon, and PepsiCo.
All these companies are blue-chip names that have demonstrated a track record of growing their dividends.
There are also signs that the ETF has become undervalued, with its trailing price-to-earnings ratio being at 18. This multiple is much lower than the Nasdaq 100 Index’s 34 and the S&P 500 Index’s 23.
Wall Street analysts recommend investing in the fund as an artificial intelligence bubble hedge.
If the bubble bursts, this will be one of the best-performing funds as we experienced earlier this year.
Indeed, the fund’s total return this year is 16%, higher than the S&P 500 Index’s 8.56%.
Most of these gains happened earlier this year when there were concerns about the AI bubble.
Still, in the long-term, the fund has underperformed the broader market.
Its total return in the last five years was 51%, much lower than the S&P 500 Index’s 91% and the Nasdaq 100 Index’s 126%.

Rocket Lab stock price crash is gaining steam: how low can it go?

AtaiBeckley stock is soaring, and it has Eli Lilly to thank

Why SpaceX stock is down another 2% today

Why Nvidia stock is down around 2.5% on Thursday

Why is TSMC stock falling despite record Q2 earnings?
No results found
Loading articles...
Failed to load articles. Please try again.