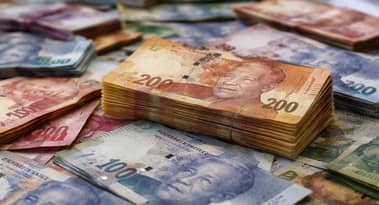
USD/ZAR forecast: rand outlook as South African inflation jumps to 4%
AI Sentiment: 72/100 Bullish
This score is generated through AI-driven analysis of the article's content.
powered by
Buy South African long-end bonds vs short-end (receive duration in the 10–30Y area): inflation is re-accelerating and SARB is likely to restart hikes (10Y ~8.90%, 30Y ~9.55%). If the Fed is reluctant to hike/cuts are discussed, the rand carry narrative can keep SA term premia elevated while the front end reprices less aggressively—steepening the curve.
Key Risk: Growth slows enough that SARB pivots to cutting or the market prices fewer hikes, compressing long-end yields and crushing the steepener.
Buy USD/ZAR (i.e., sell ZAR) into a likely rand selloff: South Africa CPI jumps to 4% and core rises, pushing SARB toward renewed hikes; that should lift ZAR yields and support ZAR, but the article’s setup is that the carry trade emerges only if SARB hikes while the Fed stays dovish—so the market reaction is likely USD strength vs ZAR near-term. Technicals back it: USD/ZAR is building a double-bottom at 16.25 with a breakout trigger at 16.91; failure below 16.25 flips the chart.
Key Risk: SARB stays on hold and the Fed turns more hawkish than expected, causing ZAR to strengthen and USD/ZAR to break down below 16.25.
- South Africa’s inflation jumped to 4%, the highest level in months.
- The jump may push the central bank to hike interest rates.
- The USD/ZAR has become a common carry trade opportunity.
The USD/ZAR exchange rate remained in a narrow range this month, even as the US Dollar Index (DXY) continued its strong rally. This consolidation may end soon as South Africa’s inflation rises and a carry-trade opportunity emerges amid rising Fed and SARB divergence.
South African rand in focus as inflation jumps
A report by South Africa’s statistics agency showed that the headline Consumer Price Index (CPI) jumped to 4% in April from 3.1% in the previous month. It jumped from 0.6% to 1.1% on a month-on-month basis. These numbers have soared to their highest level in years, undoing the central bank's good work in bringing prices down.
Core inflation, which excludes the volatile food and energy prices, also continued rising last month. It jumped to 3.6% from 3.2% on an annual basis, while softening to 0.5% on a MoM basis.
These numbers have moved further away from the South Africa’s Reserve Bank (SARB) target of 3%, with the statistics agency pointing to the ongoing Iran war for the situation.
The war has pushed energy prices sharply higher, with Brent and the West Texas Intermediate (WTI) rising to over $100. Analysts warn that these prices will continue rising in the near term, especially if President Donald Trump attacks again.
Petrol and diesel prices have jumped sharply in South Africa, with some government actions helping to ameliorate the pain.
Still, there is a likelihood that the South African central bank will restart its interest rate hikes. This explains why its bond yields have jumped, with the ten-year rising to 8.90% and the 30-year jumping to 9.55%.
Analysts predict that the next hike may come as soon as on May 28 or in the next meeting. Still, the bank may decide to maintain rates at the current level for a while now that the economy’s growth is losing momentum.
A potential carry trade?
The potential SARB rate hike will likely coincide with a Federal Reserve that seems to be reluctant to hike interest rates. It recently left interest rates unchanged between 3.50% and 3.75%, with some officials hinting of future cuts.
If this happens, it will create a carry trade opportunity. A carry trade is a situation where investors borrow a low-interest-rate currency and invests in a higher-yielding one. In this case, it would make sense to borrow the US dollar and invest in the higher-yielding rand.
The challenge, however, is that US bond yields are rising at a faster pace than interest rate expectations. For example, the ten-year yield, which tends to track the short-term rates, moved to 4.65%, higher than the upper side of the 3.75% rate.
USD/ZAR technical analysis

USDZAR price chart | Source: TradingView
The daily chart shows that the USD to ZAR pair has remained inside a narrow range in the past few weeks. It has stayed between the key support and resistance levels at 16.25 and 16.91 in this period.
The pair has formed a small double-bottom pattern at 16.25 and a neckline at 16.91. A double-bottom is one of the most common bullish reversal signs in technical analysis.
It has also moved slightly above the 50-day moving average, which is a bullish sign. Therefore, the pair will likely have a strong bullish breakout in the near term. This view will be confirmed if it moves above 16.91. A drop below the support at 16.25 will invalidate the bullish outlook.

SCHD just hit a crucial milestone: is it a good dividend ETF to buy?

From dilution to cash flow: Is BitMine stock worth buying now?

Celestica stock tumbles ahead of earnings: rebound or more pain?

BlackBerry stock has plunged 35% from the YTD high: buy the dip?
Here’s why Nigerian stocks and the naira (NGN) are soaring this year
No results found
Loading articles...
Failed to load articles. Please try again.