Solana rallies over 8%, but charts point to resistance ahead
AI Sentiment: 35/100 Bearish
This score is generated through AI-driven analysis of the article's content.
powered by
Buy SOL on a reclaim of $72 (or add on a clean hold above $70–$71). Catalysts are real: tokenized SpaceX equity on Solana, bitFlyer listing, and Moody’s tokenized credit-rating integration. The chart says momentum cooled but support is still intact; a reclaim of the 20-day EMA area (~$72) would signal buyers are taking control again and set up another push toward $75, then $78–$80.
Key Risk: SOL breaks and stays below $70–$71, turning this into a deeper downtrend back toward the prior breakdown levels.
Sell/short SOL if it fails at $75 and especially if it rejects the $77–$80 stacked resistance zone (50/100-day EMAs area). The news can drive headlines, but the chart shows weak trend reversal confirmation: below major daily EMAs, RSI still under 50, and 4-hour MACD bearish crossover—classic setup for a relief-rally fade.
Key Risk: SOL cleanly breaks and holds above $80, proving the resistance stack is support and forcing shorts to cover.
- SOL gained nearly 9% after a series of institutional adoption milestones.
- Resistance near $75 could limit further upside.
- SOL remains below major daily moving averages despite recovering.
Solana is up 8.7% over the past 7 days, supported by a series of bullish catalysts, before the rally came to a halt.
According to market data, SOL rose from around $65 earlier in the week to nearly $75 before giving back part of those gains, with the token trading near $71 on Thursday as macroeconomic pressures weighed on risk assets.
Institutional adoption drives Solana rally
The primary catalyst behind the rally was the launch of tokenized SpaceX equity on Solana.
Backpack Securities and Sunrise DeFi introduced SPCX on the network alongside SpaceX's Nasdaq debut, offering 1:1-backed and redeemable on-chain shares that can be traded around the clock.
The product gave investors exposure to one of the world's most valuable private companies while showcasing Solana's ability to support tokenized traditional assets.
Interest in the network grew further after Japanese cryptocurrency exchange bitFlyer announced the listing of Solana.
The addition opened regulated access to the asset for Japanese investors and brought one of the country's largest exchanges into the growing Solana ecosystem.
Institutional adoption also extended into fixed-income markets.
Moody's Ratings expanded its Token Integration Engine to Solana through Alpha Ledger, enabling machine-readable credit ratings to be embedded directly into tokenized debt instruments.
Moody's said the integration allows credit intelligence to become part of the underlying asset structure, reducing operational complexity for institutions working with digital securities.
According to CoinGecko, SOL rallied from roughly $65 on June 11 to more than $75 by June 16 before momentum began to cool.
Even after the recent pullback, the token remains well above its starting point for the week and is still up around 9% over seven days.
Is Solana's price at risk?
Technical indicators suggest Solana’s recovery is now facing an important test.
On the daily chart, the recent rebound comes after a prolonged decline that followed a potential double-top formation near the $95 to $100 region.
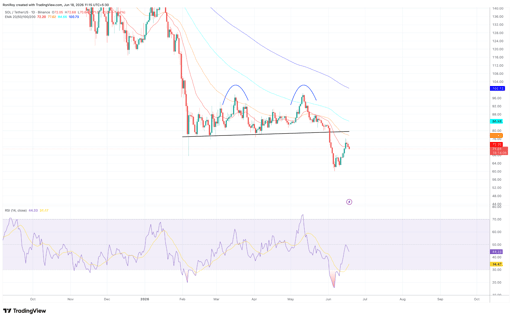
SOL/USDT 1-day price chart. Source: TradingView.
Two failed attempts to sustain gains at those levels were followed by a breakdown below a rising support trendline around $78 to $80, a development that damaged the bullish structure that had been in place since February.
Although buyers stepped in aggressively near the June lows, SOL still trades below all major daily exponential moving averages.
The 20-day EMA sits near $72.2, while the 50-day, 100-day and 200-day EMAs stand around $77.6, $84.6 and $100.7.
Those levels now form a stacked resistance zone above the current price.
Momentum has improved from the recent selloff, but confirmation of a trend reversal remains absent.
The daily RSI has recovered from oversold conditions and climbed back to around 44, showing selling pressure has eased.
However, the indicator remains below the neutral 50 level, suggesting bulls have yet to regain full control of the trend.
Meanwhile, the four-hour chart shows the recovery losing momentum after reaching the $75 region.
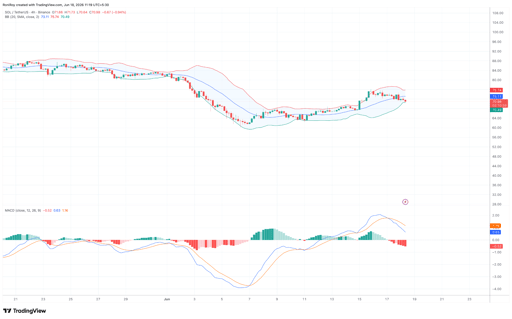
SOL/USDT 4-hour price chart. Source: TradingView.
Following the sharp advance from the $61 low, SOL pushed into the upper Bollinger Band before encountering resistance.
Price has since drifted lower toward the middle band near $73 and is now hovering close to the lower portion of the range.
The MACD indicator has also turned less constructive. A bearish crossover has formed, with the MACD line falling below the signal line while the histogram has moved into negative territory.
Such a setup often points to weak short-term momentum, particularly after a strong relief rally.
CoinGecko data shows SOL climbed more than 8% over the past seven days, but much of the advance occurred between June 15 and June 16.
Since reaching local highs near $75, the token has struggled to extend gains and has instead moved into a period of consolidation and pullback.
For now, the $70 to $71 area remains a key support zone.
Holding above that range would keep the recovery intact and leave the door open for another attempt at $75 and potentially the former support area around $80.
A break below it could place the recent rebound under renewed pressure, especially if macroeconomic uncertainty continues to weigh on risk assets.
Based on the charts, it looks like traders are now weighing the recent bullish catalysts against a more challenging macro backdrop, making the battle around current support levels particularly important in the days ahead.

Bybit expands Dual Asset features with new user experience

XRP price rises on ETF inflows: is a breakout above $1.13 now likely?

Uniswap price rallies 18% this week: are traders still underestimating UNI?

Oobit launches contactless crypto ATM cash withdrawals for users

Flowra partners with Honeypot on validator compliance infrastructure
No results found
Loading articles...
Failed to load articles. Please try again.