XRP clings to $1 as bullish chatter rises, but sellers still control the chart

AI Sentiment: 42/100 Bearish
This score is generated through AI-driven analysis of the article's content.
powered by
Buy XRP only on a confirmed reclaim: enter after a daily close above ~$1.12 (20-day EMA/Bollinger midline). Rationale: wallet creation is surging (demand building) and RSI has rebounded from oversold (~33), while open interest is low and leverage looks cautious—so upside can expand without immediate liquidation risk. Key risk: XRP breaks and holds below $1, flipping the “accumulation zone” into a renewed selloff toward the prior lows.
Key Risk: Sustained breakdown below $1 support triggers a fresh downtrend and kills the stabilization thesis.
Sell/short XRP on failed strength: if price tags ~$1.11–$1.12 and rejects (no daily close), fade the bounce toward the lower band as long as XRP remains below the 50-day EMA (~$1.20). Rationale: all major EMAs are still bearish (downtrend intact) and Chaikin Money Flow is still negative (outflows). With volatility cooled, rallies are likely to be sold until $1.20 is reclaimed. Key risk: XRP turns into a trend reversal and closes above ~$1.20, forcing shorts to cover and invalidating the “sell rallies” setup.
Key Risk: A sustained move above the 50-day EMA (~$1.20) flips momentum and squeezes shorts.
- XRP held the $1 support, but the broader downtrend remained intact.
- XRP recorded strongest daily network growth in more than three months.
- XRP must reclaim key resistance levels to strengthen the bullish outlook.
XRP has continued to hold above the $1 support level even as weak momentum has kept the token trading near multi month lows.
According to CoinGecko data, XRP traded at around $1.04 on June 30, slipping 0.2% over the past 24 hours and more than 6% over the past 7 days.
XRP price action has stayed confined to a narrow band despite several intraday swings.
After briefly climbing above $1.07 during the latest session, XRP gave back those gains and returned to the $1.04 area, with repeated rebounds continuing to keep the psychologically important $1 support intact.
Although XRP price has been struggling, on-chain activity on the network has shown fresh signs of demand.
According to a recent Santiment report, the XRP Ledger added 4,941 new wallets in a single day, the strongest daily network growth in more than three months.
The increase came while XRP traded between $1 and $1.05, an area many traders have started treating as a potential accumulation zone.
Sentiment on social media also turned more optimistic. Santiment said bullish comments outnumbered bearish ones by 3.7 to 1, the highest ratio in three months.
The analytics firm noted that XRP was still holding above the $1 support level but cautioned that stronger wallet creation would still need to translate into sustained buying demand instead of fear of missing out driven speculation.
Only weeks earlier, the same platform had reported that XRP sentiment had dropped to its weakest level since October 2025 as traders became increasingly frustrated by weak price action and the lack of fresh catalysts.
The latest rise in optimism therefore, represents a notable change in market mood, although price has yet to confirm a breakout.
XRP price analysis
According to CryptoQuant analyst Arab Chain, Binance XRP open interest had fallen to about 375.56 million XRP after peaking above 1.3 billion XRP during the second half of 2025.
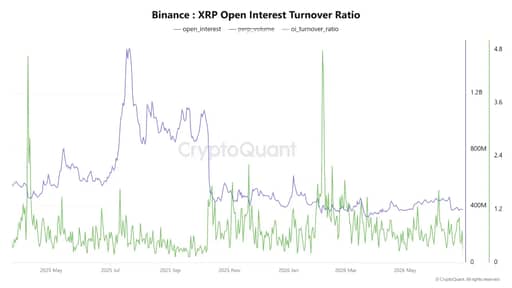
Source: CryptoQuant.
The Open Interest Turnover Ratio stood near 0.71, which the analyst said pointed to slower speculative trading and a more cautious market.
The same analysis showed XRP active addresses climbed from about 23,000 on June 14 to nearly 39,500 by June 27, an increase of roughly 72% over two weeks.
Arab Chain said lower leverage could reduce the risk of forced liquidations but warned that a sharp increase in both open interest and the turnover ratio would signal renewed speculative activity and potentially higher volatility.
Technical indicators, however, are leaning in favour of sellers.
On the daily chart, XRP was trading below its 20-day, 50-day, 100-day, and 200-day exponential moving averages, which currently sit near $1.11, $1.20, $1.31, and $1.52.
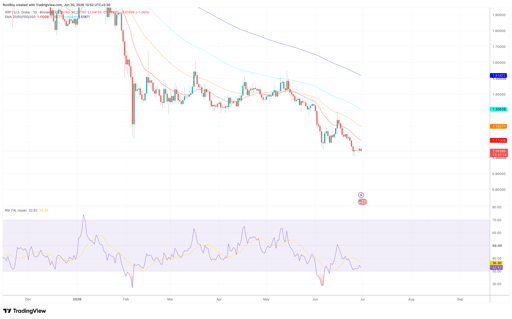
XRP/USDT 1-day price chart. Source: TradingView.
The bearish alignment of those moving averages indicates the long-term downtrend remains intact.
Simultaneously, the 14-day Relative Strength Index has recovered from deeply oversold conditions to around 32.8, suggesting selling pressure has eased, but buying strength remains limited.
Price action also continues to hover near the lower Bollinger Band, with the middle band positioned around $1.12 and the upper band near $1.24.
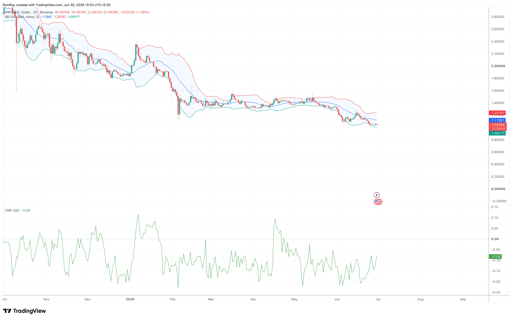
XRP/USD 1-day price chart. Source: TradingView.
Narrowing Bollinger Bands indicate volatility has cooled following June's selloff, although XRP has yet to reclaim the middle band that often acts as dynamic resistance during downtrends.
Money flow, however, has improved only slightly. The 20-day Chaikin Money Flow remained around negative 0.08, indicating capital outflows continue to outweigh inflows even though selling pressure has moderated from earlier in the month.
For now, the indicators suggest XRP has stabilised above $1 but has not confirmed a trend reversal.
A move above the 20-day EMA near $1.11 and the Bollinger midline around $1.12 would provide the first indication that buyers are regaining control, while a sustained break above the 50-day EMA near $1.20 could strengthen the case for a broader recovery.
Until then, the $1 support area remains the most closely watched level for traders.

JTO price prediction as Jito launches JTX self-custodial trading platform

Zcash price prediction: Can ZEC break above $562 after the Ironwood upgrade?
SUI price prediction: Bullish accumulation signals build

Bitget Stocks 2.0 review: can a crypto exchange become your stock broker?

Interview: Agentic AI to drive blockchain adoption, says Animoca Brands' Evan Auyang
No results found
Loading articles...
Failed to load articles. Please try again.