
Is Hyperliquid’s HYPE rally cracking as $32M transfer rattles bulls?

AI Sentiment: 35/100 Bearish
This score is generated through AI-driven analysis of the article's content.

powered by

Buy HYPE on weakness. The token is still above the 20/50/100/200-day EMAs with bullish stacking, RSI is back to neutral (~53), and CMF stays positive—this looks like post-unlock digestion, not a trend break. The $67 area (20-day EMA) is the first real line in the sand; if it holds, the market likely overreacted to treasury-to-market-maker optics.
Key Risk: HYPE breaks and closes below the ascending trendline and the $67 (20-day EMA) support, signaling real dilution/sustained selling rather than consolidation.
Sell/short HYPE if it loses $67.69 and fails to reclaim the $72–$74 supply zone quickly. The news flow (unlock + 452k transfer to exchange-linked wallets) can keep pressuring rallies; a rejection at the prior resistance would confirm momentum cooling turning into a down-leg toward the 50-day EMA (~$62.70).
Key Risk: HYPE reclaims $72–$74 and holds it for multiple sessions, proving the unlock fears were already priced and forcing shorts to cover.
- HYPE has fallen more than 6% from its weekly high.
- HYPE price remains above an ascending trendline.
- A break below the 20-day EMA could position HYPE for a correction.
Hyperliquid's HYPE token has fallen more than 6% from its weekly peak after a large transfer from the project's development wallet and this month's scheduled token unlock triggered fresh selling pressure.
According to CoinGecko market data, HYPE reached a seven-day high of $72.31 on July 7 before retreating to around $67.69, a decline of roughly 6.4% over the following two days.
The token remained up about 7.5% over the past week at the time of writing despite the latest pullback.
The latest downturn gathered pace after on-chain analyst Yu Jin reported that Hyperliquid Labs transferred 452,000 HYPE, worth about $32.3 million, from its official development wallet to crypto market maker Flowdesk.
On-chain data shared by Yu Jin showed part of the tokens remained in Flowdesk's primary wallets, while the rest moved to deposit addresses linked to OKX, Bybit and Gate.
Although the transfers do not confirm the tokens were sold on the open market, movements from a project treasury to a market maker and exchange-linked wallets are often interpreted by traders as a sign that additional supply could enter circulation.
Those concerns quickly spilled into the market, with HYPE dropping nearly 7% after the transactions became widely tracked across the crypto community.
Monthly unlock adds fresh supply
The wallet activity followed Hyperliquid's scheduled monthly token release on July 6, when approximately 9.92 million HYPE became unlocked for core contributors.
According to the available token schedule, the transfer appears consistent with the monthly contributor distribution rather than an unexpected release.
Market makers such as Flowdesk are commonly used by crypto projects to facilitate over-the-counter transactions or manage liquidity without placing large sell orders directly on exchanges.
Hyperliquid Labs has not publicly said whether the transferred tokens were intended for operational funding, liquidity management or another purpose.
The timing, nevertheless, added to market concerns because traders often reduce exposure following large unlock events.
With only about 22% of HYPE's maximum 1 billion token supply currently circulating, each monthly unlock can increase fears of dilution and prompt short-term selling.
While Hyperliquid's Assistance Fund continues to absorb part of the additional supply, those purchases have not prevented short-term volatility following monthly unlocks.
Is HYPE price at risk?
Technical indicators suggest the recent decline has weakened momentum but has not yet damaged HYPE's medium-term bullish structure.
On the daily chart, HYPE continues to trade above its 20-day, 50-day, 100-day and 200-day exponential moving averages, which remain stacked in bullish order.
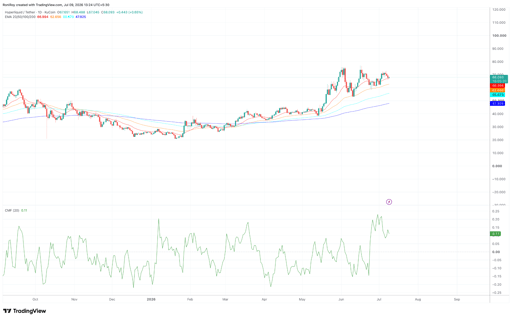
HYPE/USDT 1-day price chart. Source: TradingView
The 20-day EMA, currently near $67, is acting as the first area of dynamic support after the latest sell-off.
An ascending trendline that has guided the rally since late April also remains intact.
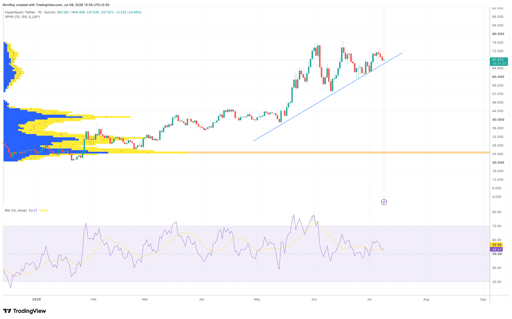
HYPE/USDT 1-day price chart. Source: TradngView
HYPE price briefly pulled back toward the trendline after rejecting the $72-$74 resistance area, but has not broken below it on a daily closing basis.
Momentum indicators also point to cooling buying pressure rather than a confirmed reversal.
The Relative Strength Index (RSI) has eased to around 53, returning to neutral territory after previously reaching overbought levels during June.
Meanwhile, the Chaikin Money Flow (CMF) remains positive at about 0.11, indicating buying activity still outweighs selling despite the recent decline.
Volume Profile Visible Range data shows the heaviest historical trading activity sits much lower around the $40-$45 region, leaving comparatively lighter traded volume near current prices.
Such conditions can make HYPE more sensitive to news-driven moves, including token unlocks and large treasury transfers.
For now, the charts suggest the recent decline is consistent with post-unlock consolidation rather than a confirmed trend reversal.
A sustained move below the ascending trendline and the 20-day EMA near $67 would weaken the current structure and could expose HYPE to the 50-day EMA around $62.70.
If selling pressure accelerates further, the 100-day EMA near $55.70 becomes the next major support.
On the upside, reclaiming the $72-$74 zone would indicate buyers have absorbed the additional supply introduced by the unlock and could reopen the path toward fresh highs.

Crypto fundraising holds near $1.36B in July as deal activity narrows

Bitget launches Fixed Coupon Notes for US stock rTokens

Pi Network forms a risky pattern despite some major upgrades

Dogecoin looks weak below $0.07, yet one signal hints the selloff is fading

Can XLM hold $0.14 as bearish traders tighten their grip on Stellar?
No results found
Loading articles...
Failed to load articles. Please try again.