Here’s why the crypto market is crashing today

AI Sentiment: 12/100 Bearish
This score is generated through AI-driven analysis of the article's content.
powered by
US–Iran escalation risk is driving a risk-off move, and spot Bitcoin ETF outflows ($733m day; $2b month) confirm Wall Street demand is fading. Technicals are broken: BTC below $73k support and under the 50/100-day MAs, with a rising wedge bearish reversal. Sell BTCUSD (or BTC futures) to ride the continuation lower across the complex.
Key Risk: A sudden de-escalation that sparks a fast ETF inflow reversal and forces BTC back above $73k/its 50-day MA.
Same macro shock plus ETF pressure: Ethereum spot ETF outflows are persistent (11 straight days; $401m month). ETH is also below $2,000, and the broader “bear trend” setup implies further multiple compression in ETH vs. risk assets. Short ETHUSD (or ETH futures) as the lagging leg of the selloff.
Key Risk: ETH reclaims $2,000 and ETF outflows stop (turn into sustained inflows), breaking the downtrend.
- Crypto selloff deepens as geopolitical fears and ETF outflows intensify.
- Bitcoin breaks key support amid rising market panic.
- Altcoins sink harder as Bitcoin and Ethereum extend sharp weekly losses.
The cryptocurrency market is under heavy pressure, with major digital assets trading sharply lower.
Bitcoin BTC fell below the key $73,000 support level, while Ethereum dropped under $2,000 as selling intensified across the sector.
Among the weaker-performing altcoins were Humanity Protocol, Render, Ondo, Virtuals Protocol, Worldcoin, and Celestia, all of which posted steeper declines than the broader market.
Crypto market crash triggered by US-Iran tensions
The latest selloff in the cryptocurrency market has coincided with rising geopolitical tensions between the US and Iran, as negotiations appear to have stalled and fears of renewed conflict intensify.
Recent reports indicate that the US military carried out additional strikes on Iranian-linked targets, with the United States Central Command (CENTCOM) describing the operations as defensive in nature.
The developments followed similar strikes earlier in the week.
Market participants are increasingly concerned that the escalation could derail ongoing diplomatic efforts.
A successful deal could help ease pressure on oil prices and inflation, potentially reducing the likelihood of further interest-rate tightening.
However, uncertainty remains high after Donald Trump said on Wednesday that he was prepared for an extended conflict if necessary. Iran has also vowed retaliation, adding to concerns that tensions could escalate further.
The uncertainty has weighed heavily on risk assets, including cryptocurrencies, as investors reduce exposure amid fears of broader geopolitical instability.
Strong Bitcoin and Ethereum ETF outflows
The cryptocurrency market remains under pressure as spot Bitcoin ETF outflows continue to accelerate.
Data shows US spot Bitcoin ETFs recorded roughly $733 million in net outflows on Wednesday, marking the largest single-day withdrawal in months.
The products have now seen more than $2 billion in outflows this month, after attracting $2.9 billion and $1.32 billion in inflows over the previous two months.
The trend has also extended to Ethereum investment products.
Spot Ethereum ETFs lost more than $67 million on Wednesday and have now posted outflows for 11 consecutive sessions, bringing monthly withdrawals to around $401 million.
The figures suggest weakening demand for crypto exposure among Wall Street investors. Analysts point to a possible rotation of capital into equities, particularly as US stock markets continue to rally.
The Nasdaq 100 and Dow Jones Industrial Average are trading near record highs, while enthusiasm around artificial intelligence has continued to drive gains in semiconductor stocks such as Micron Technology and Broadcom.
Investor attention has also shifted toward space-related stocks, with companies including Rocket Lab, Planet Labs, and Intuitive Machines posting strong gains this year amid expectations surrounding a potential SpaceX IPO.
Technical breakdown is contributing to the market crash
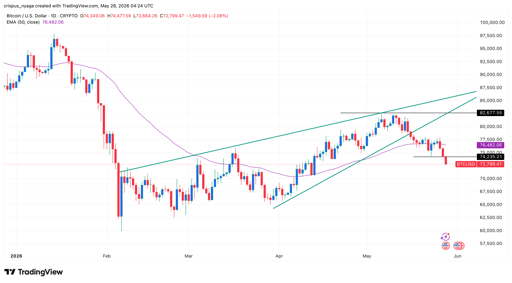
BTC price chart | Source: TradingView
A closer look at the Bitcoin and Ethereum charts shows that the two have formed highly bearish chart patterns.
For example, as the chart above shows, Bitcoin formed a rising wedge pattern, a common bearish reversal sign in technical analysis.
This pattern is made up of two ascending and converging trendlines. Bitcoin has also slumped below the 50-day and 100-day moving averages.
That is a sign that bears have prevailed, which will lead to more downside across Bitcoin and all tokens.

Will earnings be the turning point for Microsoft stock?

SanDisk stock falls as Wyckoff theory flags a risky phase

Duolingo stock has crawled back: will these gains hold as growth slows?

Corning stock drops after soft earnings guidance: buy the dip?

CSPR price climbs 5%: can Casper extend its recovery?
No results found
Loading articles...
Failed to load articles. Please try again.