XRP risks $1.05 retest as price stalls below key EMA barriers

AI Sentiment: 18/100 Bearish
This score is generated through AI-driven analysis of the article's content.
powered by
Sell XRP (XRP/USD or XRP perpetuals). Price is stuck below the 50-day EMA (~$1.27) and below the 100/200-day EMAs, keeping the near-term structure bearish. MACD histogram shows bearish momentum is weakening, but that’s not a reversal signal—more like a pause before the next leg down. If $1.13 support fails, the article flags a likely retest of $1.05; a daily close below $1.05 should accelerate selling.
Key Risk: XRP reclaims and holds above the 50-day EMA (~$1.27), flipping momentum and invalidating the $1.05 retest path.
Sell Bitcoin (BTC/USD spot or BTC futures) as a macro risk hedge against crypto-wide weakness. The article ties the drop below $63,000 to hawkish Fed signals and renewed geopolitical instability fears (Strait of Hormuz). Even if XRP has idiosyncratic ETF inflows, BTC weakness typically drags the whole complex, pressuring liquidity and risk appetite.
Key Risk: A clear risk-on reversal—BTC quickly reclaims and holds above the recent breakdown level (~$63,000) on strong demand.
- Spot XRP ETFs recorded an inflow of $2.4 million on Thursday.
- XRP is down 2.7% and now trades below $1.20 as broader market retreats.
- XRP could retest the June low of $1.05 if selling pressure persists.
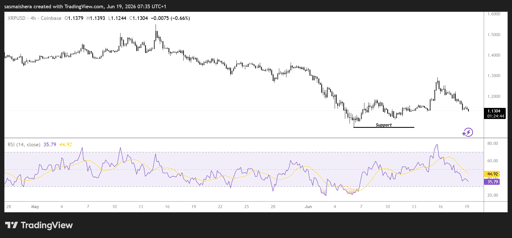
Ripple's XRP is trading below the $1.20 mark on Friday, holding short-term support near $1.13 after an early-week rally stalled at $1.28.
The rejection at higher levels has dampened market sentiment, prompting traders to reduce exposure amid growing macroeconomic uncertainty.
Weak investor sentiment weighs on crypto markets
Cryptocurrency markets have been under pressure following a hawkish signal from the Federal Reserve during Wednesday’s American trading session.
Policymakers reiterated their commitment to achieving the long-term 2% inflation target, fueling expectations that tighter monetary conditions could persist longer than previously anticipated.
Market participants also reacted to comments from Federal Reserve Chair Kevin Warsh, who appeared to prioritize economic stability over premature monetary easing during his first post-meeting press conference.
His remarks revived speculation that an interest rate increase could still be possible in 2026.
The cautious stance has triggered broad-based weakness across digital assets, erasing some of the gains recorded earlier this week after the United States and Iran announced a peace agreement aimed at ending their conflict.
However, reports of Israeli missile strikes over Lebanon have raised fears of further instability in the region, particularly regarding the security of the Strait of Hormuz, a critical global energy shipping route.
This has resulted in Bitcoin’s price dropping below $63,000, while XRP is now trading around the $1.13 level.
Institutional interest in XRP continues to surge despite the bearish price action.
Spot XRP Exchange-Traded Funds (ETFs) recorded an inflow of $2.4 million on Thursday after attracting approximately $3 million on Monday and $5 million on Tuesday.
The fresh inflows indicate that institutional investors are still interested in XRP amid heightened market uncertainty and weakening sentiment.
Derivatives data further underscores the cautious market environment.
XRP futures Open Interest (OI) fell to $2.59 billion on Friday from $2.66 billion the previous day, reflecting a reduction in speculative activity and overall risk appetite.
The decline suggests traders are increasingly closing positions rather than opening new bullish bets, reinforcing ongoing selling pressure and signaling reduced confidence in XRP’s short-term outlook.
XRP technical outlook remains bearish
The XRP/USD 4-hour chart remains bearish as XRP is trading around $1.13 at the time of writing, maintaining a bearish near-term structure as the token remains below its major Exponential Moving Averages (EMAs).
The coin is trading below the 50-day EMA at $1.27, the 100-day EMA at $1.37, and the 200-day EMA at $1.58.
As long as XRP remains below these indicators, bullish momentum is likely to remain limited.
However, technical indicators suggest that downside momentum may be slowing.
The Moving Average Convergence Divergence (MACD) histogram on the 4-hour chart points to weakening bearish momentum rather than an acceleration of selling activity.
If the bearish trend persists, XRP could retest the $1.05 support level in the near term.
A daily close below this level could trigger renewed selling pressure and accelerate XRP’s corrective trend.
For any meaningful recovery to develop, XRP would need to reclaim resistance at the 50-day EMA and sustain momentum above higher moving-average barriers.
Until then, the broader outlook remains cautious as investors continue to navigate a challenging macroeconomic environment.

PENGU price struggles after comic debut: why are traders selling?

Is XRP price at risk as Senate delays CLARITY Act vote?

CSPR price climbs 5%: can Casper extend its recovery?

Europe's 2026 digital identity deadline opens a $47B market

Nexo reaffirms EEA compliance
No results found
Loading articles...
Failed to load articles. Please try again.