Is Bitcoin headed for $53K after losing key support below $60K?

AI Sentiment: 18/100 Bearish
This score is generated through AI-driven analysis of the article's content.
powered by
Buy a downside hedge into the $57K–$58K support break: buy BTC put exposure targeting ~$53K (e.g., BTC/USD put options with strike around $53K, expiry 4–8 weeks). The thesis is that capitulation-like exchange inflows and the realised-price level (~$53.3K) create a high-probability “magnet” lower if $57K–$58K fails.
Key Risk: A sharp risk-on continuation (equities stay strong, USD/JPY stabilizes) triggers a fast rebound above $62K, making puts lose value.
Sell/avoid BTC spot while it’s below $60K and still under the 20/50/100/200-day EMAs (bearish stack). The article flags: (1) weak spot demand as institutions rotate into US tech, (2) exchange inflows rising from 6–12 month holders—loss-taking supply, and (3) technical structure still down with ADX ~38. Expect a retest of the realised-price support near ~$53.3K after a break of the $57K–$58K zone.
Key Risk: BTC reclaims $60K and then $62.1K (20-day EMA) quickly, flipping trend and squeezing sellers before $53K is tested.
- Bitcoin could drop toward $53K as macro pressure builds.
- Holder capitulation continues to weigh on BTC.
- Technical indicators remain bearish for Bitcoin on the daily chart.
Bitcoin has remained below $60,000 as mounting macroeconomic and on-chain risks have increased the likelihood of another sharp decline, with some analysts warning the cryptocurrency could revisit the $53,000 area before establishing a durable bottom.
According to market data, Bitcoin BTC slipped toward $58,000 before recovering to around $59,300, extending a month-long decline that has left the asset nearly 20% lower while US equity markets continue to post strong gains.
Despite the latest rebound, traders have remained cautious as Bitcoin struggles to reclaim the $60,000 level that previously acted as support.
The cryptocurrency briefly found buyers near $58,000 during the latest sell-off, but the recovery has done little to change the market's bearish structure.
According to research firm The Kobeissi Letter, the S&P 500 gained 14% during the second quarter, its strongest quarterly performance since 2020, while the Nasdaq 100 climbed 25%, putting it on track for its second-best quarterly performance in 25 years.
The firm said the rally in global equities has continued to accelerate, led primarily by US stocks.
The divergence has led analysts to argue that institutional money is increasingly flowing into large-cap US technology stocks instead of digital assets.
As more capital is allocated to equity markets, buying demand for spot Bitcoin weakens, leaving the cryptocurrency more exposed whenever selling pressure increases or liquidity becomes thin.
Currency markets have also emerged as another source of concern.
The US dollar strengthened to its highest level against the Japanese yen since the mid-1980s after USD/JPY climbed to 162.50, raising expectations that Japanese authorities could intervene in foreign exchange markets.
Commenting on the development, analyst George Gammon warned that countries and institutions facing dollar shortages often liquidate highly liquid assets to obtain cash.
"You've got dollar liabilities and not enough dollars. So you sell assets to get dollars, putting downward pressure on the asset. Yen, Rupees, Won, or Bitcoin," he wrote.
The pressure from global dollar shortages has also been cited as a factor weighing on Bitcoin because financial institutions and sovereign entities facing foreign exchange stress can quickly sell digital assets, which trade around the clock, to raise dollars and meet liabilities.
Bitcoin price technical outlook keeps $53,000 in focus
Alongside macroeconomic headwinds, on-chain data has started showing signs that investors who bought near Bitcoin's record highs are beginning to exit the market.
According to CryptoQuant contributor Crypto Sunmoon, exchange inflows have risen sharply since Bitcoin fell below $70,000, with much of the transferred supply coming from coins that had been held for roughly six to twelve months.
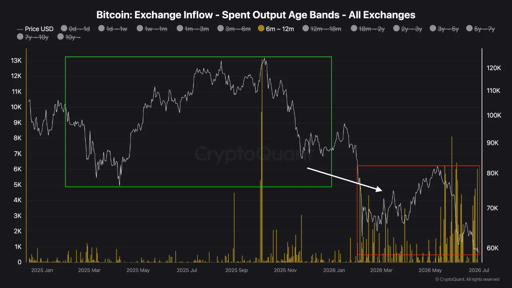
Source: CryptoQuant.
The coins were likely accumulated near the cycle highs, indicating many recent buyers are now selling at a loss instead of waiting for a recovery.
Crypto Sunmoon said this behavior is consistent with capitulation among cycle-top investors, adding that "holders appear to be cutting losses rather than continuing to hold through the drawdown."
While such selling has increased short-term pressure, the analyst noted that similar capitulation events during the 2018 and 2022 bear markets eventually coincided with long-term bottom formation as weaker holders transferred coins to longer-term investors.
Looking beyond current selling activity, CryptoQuant also identified Bitcoin's realised price, currently around $53,300, as one of the market's most important long-term support levels.
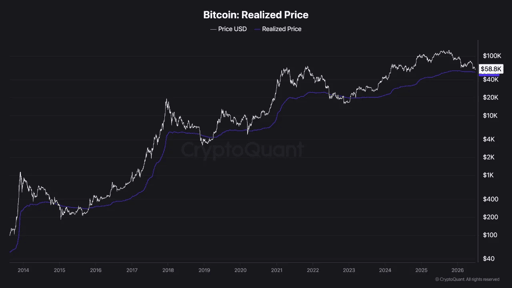
Source: CryptoQuant.
The realised price represents the average price at which the circulating Bitcoin supply last moved on-chain.
Looking back at previous market cycles, Crypto Sunmoon said every recurring bear market eventually pushed Bitcoin below its realised price, creating what he described as the best long-term investment opportunities.
The analyst suggested investors should watch for a similar setup if the price falls beneath that level again.
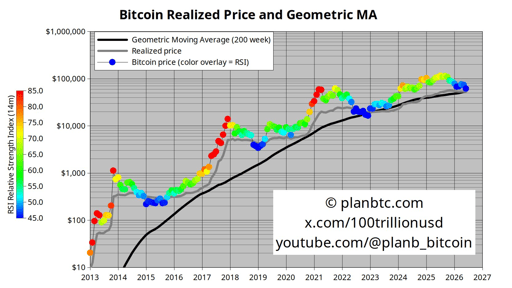
A similar assessment has been offered by PlanB, creator of the Stock-to-Flow model.
Earlier this month, PlanB said the market remained evenly divided over whether February's move to around $60,000 had already established the cycle bottom or whether the bear market still had further to run.
Source: PlanB on X.
Based on his analysis, he said there was a more than 50% probability Bitcoin would decline below both the 200-week moving average and its realized price near $53,000 before completing a bottoming process.
In a later post, he added that Bitcoin would "likely bottom below" the realized price.
Bitcoin will likely bottom BELOW Realized Price (~$53k), just like it did in EVERY previous bear market.
— PlanB (@100trillionUSD) June 25, 2026
Right now the grey Realized Price line has been glued to the black 200-week Geometric MA line since 2023.
What do you think: new low incoming or different this time?👇 pic.twitter.com/LUFUNLblV6
Joining PlanB, market commentator Aaron Bennett also said he would be surprised if Bitcoin did not revisit the realised price or even trade below it for several weeks despite institutional participation that was absent during previous bear markets.
Every bear market we touch the Realized Price. It's at $53,000 right now.
— Aaron Bennett (@Aaronbennett) June 26, 2026
I'd be surprised if we don't touch this, or go below it for a few weeks. pic.twitter.com/J2PpkmgcIf
To top this off, Bitcoin’s technicals as of press time continue to favor caution.
Bitcoin remains below its 20-day, 50-day, 100-day and 200-day exponential moving averages, which are positioned near $62,100, $66,300, $70,100 and $76,200.
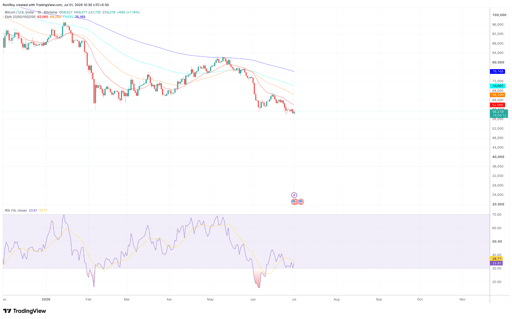
BTC/USD 1-day price chart. Source: TradingView.
The bearish alignment of these moving averages indicates sellers continue controlling the higher-timeframe trend, while each average has become a potential resistance level that Bitcoin would need to reclaim before sentiment improves.
Momentum indicators also suggest downside risks have not fully disappeared.
The daily Relative Strength Index (RSI) is hovering near 34, showing that selling pressure has eased from recent extremes but remains close to oversold territory.
At the same time, Bitcoin is trading near the lower Bollinger Band around $57,700, indicating that bearish momentum continues to dominate despite the latest rebound.
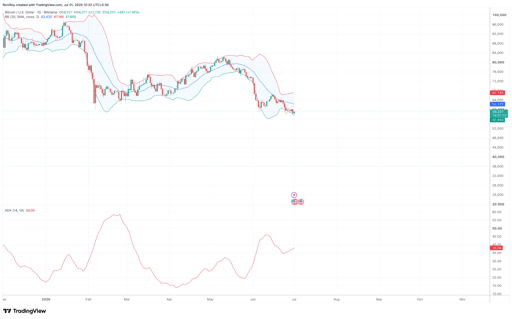
BTC/USD 1-day price chart. Source: TradingView.
Another indicator points to the trend itself remaining strong.
The Average Directional Index (ADX) has climbed to around 38, suggesting the existing downtrend still has strength and there’s more room for downside action before it cools off.
Combined with Bitcoin's sequence of lower highs and lower lows, the charts indicate that a break below the $57,000-$58,000 support region could expose the next major downside target near CryptoQuant's realised price around $53,300.
On the upside, analysts would likely need to see Bitcoin reclaim the 20-day EMA near $62,100 before considering a more sustained recovery.

JTO price prediction as Jito launches JTX self-custodial trading platform

Zcash price prediction: Can ZEC break above $562 after the Ironwood upgrade?

SUI price prediction: Bullish accumulation signals build

Bitget Stocks 2.0 review: can a crypto exchange become your stock broker?

Interview: Agentic AI to drive blockchain adoption, says Animoca Brands' Evan Auyang
No results found
Loading articles...
Failed to load articles. Please try again.