Is Jupiter price preparing for another breakout or a pullback?

AI Sentiment: 68/100 Bullish
This score is generated through AI-driven analysis of the article's content.
powered by
Buy Jupiter (JUP) spot. Protocol revenue and staking/governance cash flow are improving (SOL fees and protocol revenue up after three months of decline), and price is still above the 20/50/100/200-day EMAs with bullish order. Derivatives positioning is supportive (positive funding, open interest up), so dips are more likely to be bought than trend-reversed. Play the $0.228 support zone; target a breakout through $0.236–$0.24, then $0.258.
Key Risk: A decisive break below ~$0.228 that flips the uptrend—revenue narrative won’t matter if price starts trending down again.
Sell/short JUP on a rejection at $0.236–$0.24. The rally repeatedly stalls in that band, momentum is cooling (MACD histogram contracting), and there’s downside liquidity near $0.227–$0.228 (largest long liquidation cluster). If price fails to reclaim the resistance, expect a pullback toward $0.208.
Key Risk: JUP cleanly clears and holds above $0.24, triggering more longs and squeezing shorts as liquidity above gets consumed.
- Jupiter's uptrend remains intact above key support.
- Momentum is cooling as price struggles to break above $0.24 resistance.
- Support near $0.228 could decide whether the rally resumes or weakens.
Jupiter price started the month with a rally after improved protocol revenue renewed bullish sentiment among the community.
However, the token has since pulled back from its recent high amid questions over whether the recovery can extend further.
According to CoinGecko data, Jupiter JUP rose to an intraday high of $0.24 on July 1 before easing to around $0.23, giving back part of its gains while remaining well above levels seen earlier in the week.
The rally followed a strong recovery in on-chain activity during June.
Data from DeFiLlama showed the Solana-based decentralized exchange generated 261,909 SOL in user fees and 76,257 SOL in protocol revenue last month, ending three consecutive months of declining network activity.
Part of that protocol revenue is directed toward Jupiter's staking and governance system, helping revive investor demand for the token as cash flow improves.
Derivatives traders also backed the move as market data from Coinalyze showed open interest increased by about 11% to $58.7 million during the rally, while funding rates remained positive.
This is a sign that leveraged traders continued paying to hold long positions.
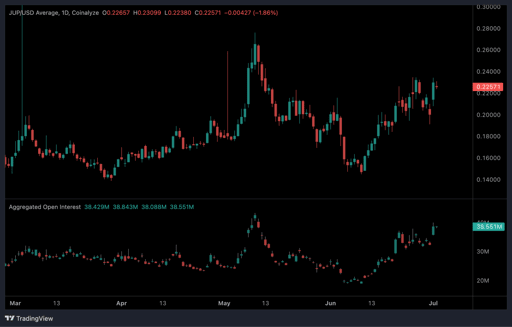
JUP/USD 1-day price chart. Source: TradingView.
JUP price analysis
Although Jupiter has surrendered part of its recent gains, the daily chart still shows buyers maintaining control of the medium-term trend.
The token continues trading above its 20, 50, 100 and 200-day exponential moving averages, while the moving averages remain in bullish order, indicating the recovery that started in June is still intact.
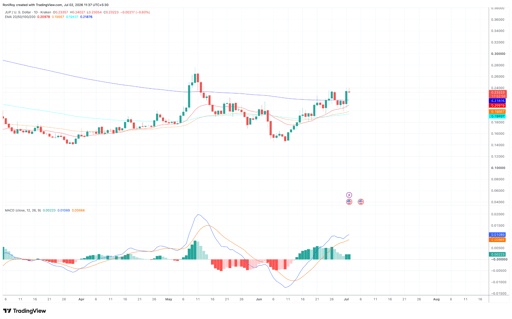
JUP/USD 1-day price chart. Source: TradingView.
Momentum indicators, however, suggest the rally has begun to cool.
The daily MACD remains above its signal line, but the histogram has started to contract, showing that bullish momentum is weakening even though the indicator has not turned negative.
The 4-hour chart also suggests bullish momentum remains intact despite the latest retracement.
On the 4-hour chart, JUP remains above an ascending trendline and the 0.786 Fibonacci retracement level after reclaiming most of its previous decline, while the relative strength index sits near 60, leaving room for further gains without entering overbought territory.
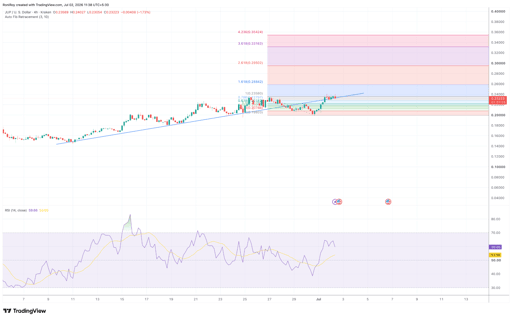
JUP/USD 4-hour price chart. Source: TradingView.
At the same time, as is evident, the rally has repeatedly stalled around the $0.236-$0.24 area, making it the first resistance zone traders are watching.
A sustained move above that region could shift attention toward the next Fibonacci extension around $0.258, while initial support sits near $0.228, followed by the $0.208 area if selling pressure increases.
The latest JUP liquidation heatmap shows the largest cluster of long liquidations sits around $0.227-$0.228, just below the current market price, suggesting the area could attract price if sellers regain control.
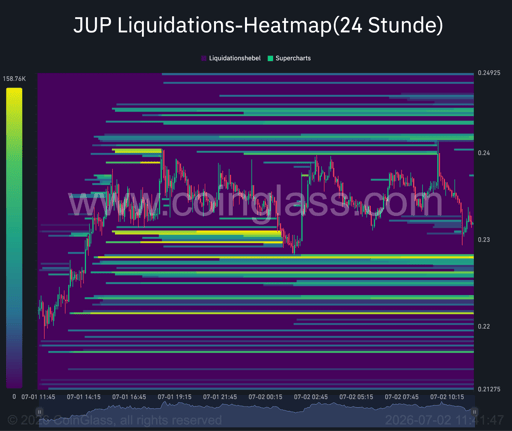
JUP 24-hour liquidation heatmap. Source: CoinGlass.
Above the market, liquidity is spread across roughly $0.24, $0.243-$0.245 and, $0.249, leaving several upside targets if buyers manage to clear nearby resistance.
As of publication time, the technical indicators suggest Jupiter's rally may just be cooling off and there’s still space to run.
While weakening momentum and nearby downside liquidity leave room for a short-term pullback, the token continues to trade above key moving averages with positive derivatives positioning, leaving the current uptrend intact unless support around the $0.228 region breaks decisively.

AAVE price forecast: bulls eye $125 as bull flag breakout nears

Injective price forecast: Coinbase integration strengthens bullish case for INJ

Bitcoin price outlook: treasury sell-offs, Poolin bankruptcy and $1.2B options expiry

CryptoRank study finds Bitget rTokens saw up to 58% lower slippage on $50K orders

How high can BEAT go as whale withdrawals drain exchange supply?
No results found
Loading articles...
Failed to load articles. Please try again.