
XRP loses $1.45 as leveraged traders turn a red-hot rally into a danger zone

AI Sentiment: 28/100 Bearish
This score is generated through AI-driven analysis of the article's content.

powered by

Buy XRP spot ETF exposure (e.g., Bitwise XRP ETF / Franklin Templeton XRP ETF). The derivatives market is unstable, but ETF flows are still positive ($28.14m net inflows Aug. 26; ~$1.62b cumulative). That creates a stabilizing bid that can absorb selloffs when leveraged longs unwind, especially if XRP dips into $1.35–$1.30 and spot demand steps in.
Key Risk: ETF inflows flip to sustained outflows, removing the main stabilizer while leverage keeps pressuring price.
Sell XRP (via XRP/USDT or XRP perpetuals). Leverage is crowded: Binance long/short ~2:1 (top traders ~3:1) and $15m of longs liquidated in 24h, which usually triggers more forced selling and keeps rallies capped. Price action also shows lower highs and failure to hold $1.50–$1.55; a break below $1.35–$1.36 likely accelerates unwind toward $1.30 and then $1.20–$1.25.
Key Risk: XRP reclaims and holds $1.55, forcing a long squeeze that turns liquidations into fresh buying.
- XRP has fallen towards $1.40 after reaching nearly $1.70.
- XRP leverage on Binance has reached its highest since January.
- $1.35 remains the key support for XRP.
XRP has fallen to around $1.41 after trading near $1.50 on Aug. 25, extending its pullback from last week’s $1.70 high even as the token remains up more than 27% over seven days.
According to CryptoQuant data, XRP’s estimated leverage ratio on Binance climbed to roughly 0.21 this week, its highest level since January, as traders increased leveraged exposure during the token’s rally from around $1 in mid-August.
Much of that positioning remained in place even after XRP began retreating from its recent high.
Futures open interest stood at roughly $3.45 billion, while 24-hour futures volume reached around $6.4 billion, more than five times the roughly $1.2 billion recorded in spot trading.
The risk was compounded by traders leaning heavily towards further gains.
CoinGlass data showed roughly two long Binance accounts for every short account, with the ratio among top traders approaching three to one. OKX recorded a similar imbalance, with roughly two longs for every short.
As XRP moved lower, some of the crowded long positions began to unwind.
Around $18.9 million in XRP positions were liquidated over one 24-hour period during the correction, including roughly $15 million in longs, adding forced selling to an already weakening market.
The pullback came after XRP had climbed from around $1 in mid-August to nearly $1.70, giving short-term traders substantial profits to lock in.
Buyers struggled to sustain the price above $1.50-$1.55 following the peak, and XRP subsequently fell below $1.45 before briefly approaching $1.37 on Aug. 27 and recovering towards $1.41.
Signs of stress in the derivatives market had emerged several days earlier.
During the market-wide liquidation event on Aug. 22, XRP experienced sharp volatility after trading near $1.67-$1.70, with Bitstamp briefly recording a wick of roughly 37%.
The decline was considerably smaller on Kraken and OKX, but open interest remained around $3.66 billion after the event, showing that a large portion of leveraged exposure had stayed in the market.
While leverage and profit-taking have weighed on the price, demand through US spot XRP ETFs has continued.
According to SoSoValue data, the products recorded $28.14 million in net inflows on Aug. 26, lifting cumulative net inflows to roughly $1.62 billion. Bitwise led the session with $13.12 million, followed by Franklin Templeton at $9.02 million.
The latest inflows followed several positive sessions, with cumulative net inflows already at $1.57 billion through Aug. 24.
XRP’s initial rally developed alongside strength across the crypto market after the US Treasury expanded its bond-buyback programme, helping push long-term yields lower.
Bitcoin moved from below $68,000 towards $80,000 during the same period, while XRP recorded a much larger percentage gain.
Ripple-related developments also supported XRP during the rally. Ripple backed a new institutional credit fund that plans to issue loans denominated in its RLUSD stablecoin through the XRP Ledger.
Separately, XRP Ledger data showed increased network activity during the overlap between London and New York trading hours, when liquidity across major financial markets is typically higher.
XRP price analysis
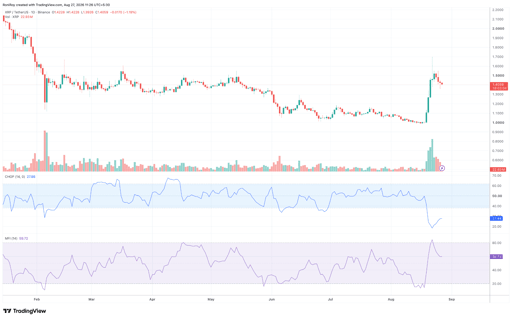
XRP’s daily chart shows the token trading near $1.41 after the rally from around $1 produced a sharp spike towards $1.70.
The subsequent candles have formed lower highs, with buyers failing to regain the $1.50 area as the initial surge in trading volume has eased. See below.
XRP/USDT 1-day price chart. Source: TradingView.
The daily Choppiness Index has fallen to 27.86, well below the 38.2 level commonly associated with a strongly directional market.
With XRP currently moving lower from its $1.70 peak, the reading shows that the pullback is developing as a directional move instead of price simply moving sideways after the rally.
Money flow remains considerably stronger. The daily Money Flow Index stands at 59.72, after briefly moving above 80 during the initial price surge.
The fall from overbought territory shows that some of the buying pressure behind the rally has eased, but a reading close to 60 leaves the indicator well above oversold levels.
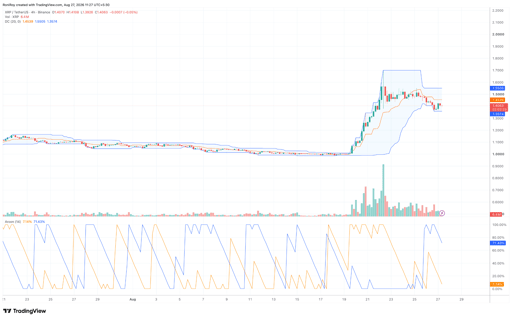
On the 4-hour chart, XRP has moved below the Donchian Channel midpoint at $1.4539, putting the lower boundary at $1.3574 into focus.
XRP/USDT 4-hour price chart. Source: TradingView.
The price has already approached that area during the latest decline before rebounding towards $1.40.
A sustained break below $1.35-$1.36 would push XRP beneath the lower end of its current 4-hour range.
The next visible price area sits around $1.30, with the earlier breakout region around $1.20-$1.25 becoming relevant if selling accelerates and leveraged longs continue to unwind.
The 4-hour Aroon indicator has not confirmed a complete trend reversal yet.
Aroon Up stands at 71.43%, compared with Aroon Down at 7.14%, showing that the strong highs created during the recent rally still carry more weight within the indicator’s lookback period.
For buyers, the first recovery level sits around the Donchian midpoint at $1.45-$1.46.
Reclaiming that area would put $1.50 back in play, while the upper Donchian boundary near $1.55 represents the next technical hurdle.
A move through $1.55 would leave the recent $1.67-$1.70 peak as the next major resistance area.
On the downside, the $1.35-$1.36 zone remains the immediate level to watch while XRP’s derivatives market carries $3.45 billion in open interest and long accounts continue to outnumber shorts.

Bitcoin falls below $79,000: Is the August rally starting to crack?

Bitcoin holds at $78,000 as ETF inflows support recovery

XRP loses $1.50 after explosive rally: why are traders taking profits now?

Can ZRO hit $1.46 after LayerZero launches ATLAS?

Will TRUMP price crash as team-linked wallets cash out $3.39M?
No results found
Loading articles...
Failed to load articles. Please try again.