
Dow Jones forecast as the Fear and Greed Index drops to 32

AI Sentiment: 58/100 Bullish
This score is generated through AI-driven analysis of the article's content.

powered by

Fear & Greed at 32 (fear) plus the bullish-flag setup and the Dow holding above the 100-day EMA point to a rebound into August. Buy: iShares Dow Jones Industrial Average ETF (DIA). Thesis: sentiment is washed out, technical trend support remains, and upcoming earnings (AMZN/AAPL/HD/WMT) can re-ignite momentum.
Key Risk: A sustained break below the 100-day EMA that turns the bullish flag into a real downtrend.
The article flags Iran risk as a driver for higher crude, which would normally help inflation fears. But the Dow is already in fear and rates are the bigger swing factor; if the market is pricing escalation, the next move is often a fade after the initial shock. Sell: United States Oil Fund (USO). Thesis: crude upside is already crowded, and any de-escalation or demand worries will hit oil fast, easing inflation pressure and supporting equities.
Key Risk: A clear escalation that pushes crude into a sustained breakout, keeping inflation/rate fears elevated.
- The Dow Jones Index has pulled back in the past few days.
- It has formed a bullish flag pattern that normally leads to a rebound.
- The Fear and Greed Index has tumbled to the fear zone.
The Dow Jones Industrial Average has gained about 6.5% this year and remains close to its record high. However, the index has recently retreated to around 51,600, down more than 3.25% from its peak as investor sentiment has weakened, with the Fear and Greed Index slipping into the Fear zone.
This pullback has raised questions about whether the recent rally is losing momentum or simply taking a breather before the next leg higher. In this article, we examine the key technical and fundamental factors that could shape the Dow's direction in the coming weeks.
Dow Jones has dropped as risks rise
The Dow Jones Index has fallen in the past few weeks as investors embrace a sense of fear as risks rise. One of the risks is the Federal Reserve, which delivered its interest rate decision on Wednesday. As was widely expected, the bank decided to leave interest rates unchanged between 3.50% and 3.75%.
The main hawkish element is that three officials bucked the trend and voted to hike interest rates. As a result, odds that the Fed will hike rates by December have jumped to over 70% on Polymarket. US bond yields have also jumped, with the benchmark ten-year approaching its all-time high.
Investors are also fearful about the ongoing US-Iran war that resumed recently. The two sides have continued launching strikes this week, with Iran denying that it was having talks with the US. An escalation will push crude oil prices higher in the coming weeks.
Higher oil and natural gas prices will fuel inflation and push the Fed to intervene by hiking interest rates.
The Dow Jones is also exposed to the ongoing volatility in the artificial intelligence boom that has pushed some of its biggest constituents much lower. For example, Caterpillar, which has seen strong data center demand, has plunged by 27% from its highest point this year.
Cisco, the top gainer this year, has dropped by 13% from its peak, while Nvidia is down by 20%. Other AI stocks in the index like Microsoft, IBM, and Salesforce have all tumbled this year.
Some of its top companies have published weak financial results. For example, IBM stock tumbled after its earnings and guidance came short of expectations. American Express and Visa also gave a weak guidance.
Fear and Greed Index has tumbled
As a result, the Fear and Greed Index has moved into the fear zone of 32. Key benchmarks in the index like the market momentum and stock price breadth have moved to the extreme fear zone.
On the other hand, safe haven demand, market volatility, and put and call options have moved to the fear zone. In most cases, bull runs start whenever this gauge falls to the fear or extreme fear zones.
Looking forward, the index will react to earnings from some of its top constituents like Amazon, Apple, Home Depot, and Walmart.
Dow Jones Index technical analysis
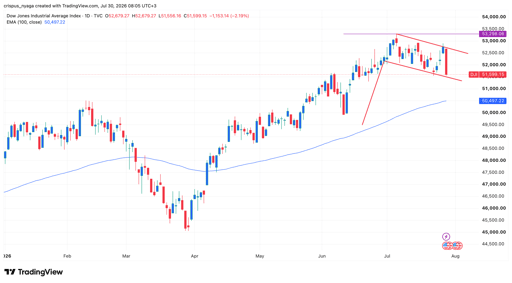
DJI chart | Source: TradingView
The daily chart shows that the Dow Jones Index has pulled back in the past few weeks. It dropped from the year-to-date high of 53,298 to the current 51,600.
On the positive side, this retreat seems to be part of the formation of the bullish flag pattern. This is a popular pattern made up of a vertical line and a descending channel.
The index has also remained above the 100-day Exponential Moving Average (EMA), a sign that the recent uptrend is still intact. Therefore, the index will likely be highly volatile ahead of a strong rebound in August.

Can Bumble, Tinder make a comeback as users leave apps

What do Walmart's and Target’s results say about the US consumer?

S&P 500 record masks $1.5 trillion leverage trap beneath Wall Street’s AI boom

Dow closes 500 pts higher as Wall Street rebounds from Treasury yield-driven sell-off

Evening digest: Samsung buybacks rise as Bitcoin, oil rally
No results found
Loading articles...
Failed to load articles. Please try again.