
Why is PUMP price surging 30% and can the rally survive the next unlock?
AI Sentiment: 58/100 Bullish
This score is generated through AI-driven analysis of the article's content.

powered by

Buy PUMP. The article ties the rally to real platform economics: Pump.fun revenue is rising and 50% of net revenue is programmed to buy and burn PUMP for a year, tightening supply while demand is boosted by the new social “callout” product and zero-fee/cross-chain USDC. Technicals are bullish (above Supertrend and above the upper Bollinger Band), with the next upside targets at $0.0028 then $0.0030 and $0.0031–$0.0032 if $0.0027 holds.
Key Risk: The Aug 14 unlock dumps into exchanges and overwhelms the buy-and-burn mechanism, pushing PUMP below $0.0027 and triggering a fast supply-driven selloff.
Buy PUMP call options (or a small call spread) into the $0.0028–$0.0030 breakout. The setup is “revenue-to-burn” plus product-driven volume (>$113M first 24h after the update). Options capture upside if price clears $0.0028 while limiting damage if it mean-reverts after being overbought (4-hour Stoch RSI >80).
Key Risk: Price rejects at $0.0028 and momentum cools into consolidation before the unlock, causing option time decay and capping gains.
- PUMP has gained 12.5% in 24 hours and over 30% this week.
- Pump.fun’s 30-day revenue reached $33.73 million.
- PUMP has broken above the daily upper Bollinger Band near $0.00270.
PUMP price has rallied more than 30% over the past seven days as rising platform revenue, a new social trading product and a surge in memecoin activity have supported demand.
CoinGecko data provided on Aug. 10 showed PUMP up about 12.5% over 24 hours at $0.002763, extending its seven-day gain to 31.9%, while the token had climbed 39.5% over 14 days and 91.3% over the past 30 days.
One of the latest catalysts has come from Pump.fun itself after the Solana-based token launchpad rolled out an updated social trading product on August 7.
The update introduced “callout” tokens, which allow users to alert their followers to tokens from inside the app, alongside zero-fee trading and cross-chain USDC support.
According to CoinGecko data, trading volume topped $113 million during the first 24 hours following the launch.
The product update gives traders another reason to use Pump.fun at a time when activity on the platform has already been recovering.
Revenue has become particularly important for PUMP because Pump.fun now links half of its earnings directly to purchases and burns of its native token.
Data from DeFiLlama shows Pump.fun generated $33.73 million in revenue over the past 30 days, putting it ahead of perpetual futures exchange Hyperliquid at $32.73 million over the same period.
Higher revenue feeds into a token supply mechanism introduced in April. Pump.fun announced on April 28 that it had burned about $370 million worth of previously repurchased PUMP, equivalent at the time to roughly 36% of circulating supply.
The platform also changed its revenue policy so that 50% of future net revenue would automatically purchase PUMP from the open market and burn the acquired tokens for one year.
Consequently, rising platform revenue can increase the amount allocated to programmed PUMP purchases, while the subsequent burns remove the acquired tokens from supply.
The remaining half of revenue was reserved for areas including product development, hiring, marketing and potential acquisitions, according to the April announcement.
Memecoin trading has provided another source of support. As of last week, memecoin prices across Pump.fun have regained traction, and speculative trading continued over the weekend.
For Pump.fun, increased token creation and trading can translate into more fee-generating activity across its products.
PUMP price analysis
On the daily PUMP/USDT chart provided, the token was trading around $0.002765 on Aug. 10 after climbing from approximately $0.0012 in late June.
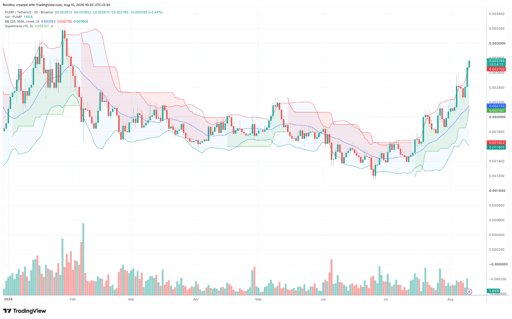
PUMP/USDT 1-day price chart. Source: TradingView.
The rally accelerated during the second half of July, with PUMP establishing a sequence of higher lows before moving above $0.0020 and then extending toward $0.0028.
Bollinger Bands show how far the latest move has stretched from its recent average.
The 20-day middle band sits near $0.002153, while the upper band is around $0.002700 and the lower band is approximately $0.001605.
At roughly $0.00276, PUMP has moved above the upper Bollinger Band.
A move outside the upper band can accompany strong upside momentum, particularly during an expanding trend, but it also means price has moved substantially above its 20-day average.
The daily Supertrend remains bullish. Its support line is positioned around $0.002107, well below the current price, leaving PUMP above both the Supertrend and Bollinger Band midpoint.
Those readings put the first upside area around $0.0028, where the latest daily candle has already traded.
A sustained move through that zone would bring the psychological $0.0030 level into focus, followed by the late-January price area around $0.0031-$0.0032 visible on the daily chart.
Failure to hold the breakout could instead pull PUMP back toward the upper Bollinger Band near $0.00270.
Below that, the recent breakout area around $0.0024-$0.0025 could become the next support zone before the 20-day Bollinger midpoint near $0.00215 and Supertrend support around $0.00211.
The 4-hour chart supports the bullish trend but is showing signs that momentum has become overheated.
See below:
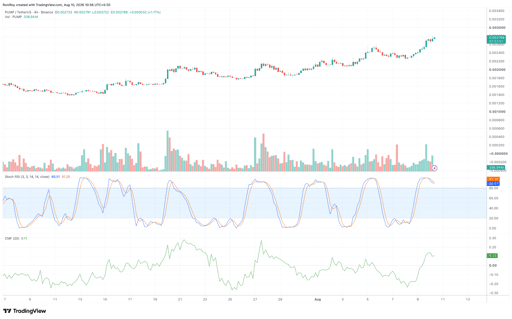
PUMP/USDT 4-hour price chart. Source: TradingView.
Pump.fun’s Stochastic RSI stood at 88.91 and 91.20 on the 4-hour chart. Both readings are above the indicator's 80 threshold, placing short-term momentum in overbought territory.
The two Stochastic RSI lines have also started turning lower from close to the top of their range.
If that continues while price struggles around $0.0028, the indicator would support the possibility of a short-term consolidation or pullback following the latest rally rather than another immediate vertical move.
Chaikin Money Flow gives a more supportive reading. The 4-hour CMF was around 0.11, having moved sharply above zero during the latest advance.
A positive CMF means buying pressure has outweighed selling pressure over the indicator's measurement period.
In PUMP's case, the positive reading accompanies higher prices, so the 4-hour rally has not yet been accompanied by a clear deterioration in money flow.
Together, the indicators leave PUMP in a strong but stretched technical position.
For bulls, holding above roughly $0.0027 would keep the immediate breakout intact and leave $0.0028 as the first level to clear.
A confirmed break above that area could expose $0.0030 before the January supply zone around $0.0031-$0.0032.
A rejection near $0.0028 combined with a continued Stochastic RSI decline would put the $0.0026-$0.0027 area back in play.
If selling pressure builds, PUMP could fall back toward $0.0024–$0.0025, with the daily Bollinger midpoint and Supertrend providing the next support around $0.00211–$0.00215.
PUMP is also heading into a major token unlock, with about 7.07 billion tokens scheduled to enter circulation on August 14, which would give traders a fresh supply event to consider after the token’s recent rally.
If a portion of the newly unlocked tokens reaches exchanges, the added supply could increase selling pressure and make it harder for PUMP to extend its recent gains.

Strategy, Coinbase stocks rally as Bitcoin reclaims $80,000

Bitcoin reclaims $80K as Fed rate-hike odds fall on Fed Governor's comments

Can Bitcoin price reach $80,000 after its latest breakout?

Flowra, KorDA sign MOU to explore gold-backed Solana validator infra

Bahrain leads the Middle East stablecoin race, but where are the coins?
No results found
Loading articles...
Failed to load articles. Please try again.