
Why is Solana price surging, and can SOL finally break above $100?

AI Sentiment: 72/100 Bullish
This score is generated through AI-driven analysis of the article's content.

powered by

Buy Solana (SOL-USD). The setup is institutional bid plus near-term catalysts: validator voting on SGP 1–3 (governance framework, faster disinflation, fee changes with burn). Price action is already bullish (above 50D EMA ~79 and 200D EMA ~92.67). Trade for a daily close above $100; that’s the trigger that turns “rally” into “trend,” with upside toward $112.52.
Key Risk: A daily close back below the 200-day EMA (~$92.67) that signals the $100 breakout fails and momentum rolls over.
Buy Solana ETF exposure (e.g., SOL-focused spot ETF shares). The article flags four straight days of inflows totaling ~$28.34M and the highest weekly inflow in two months. If flows persist after the price surge, it creates a second wave of buying that can carry SOL through $100 even during consolidation.
Key Risk: ETF inflows stop or reverse for multiple sessions, removing the incremental buyer that’s propping up the breakout.
- Solana is trading above $94 on Monday after gaining 27% last week.
- SOL-focused ETFs recorded four consecutive days of inflows totaling $28.34M.
- SOL must close decisively above $100 to target the resistance at $112.52.
Solana is up by 1% in the last 24 hours and is trading above $94 on Monday after rising 27% last week and reaching its highest level in two months.
SOL maintains a bullish near-term structure as it trades above its major moving averages.
Renewed institutional demand and the start of validator voting on three network proposals provide fundamental support for the token.
However, the rapid price increase has pushed momentum indicators into overbought territory, suggesting SOL could consolidate before attempting a sustained breakout above $100.
Solana validators begin voting on three proposals
Solana validators began voting Monday on SGP 1, SGP 2 and SGP 3, with the process scheduled to end Thursday.
Solana Validator Governance
— Solana Developers (@solana_devs) August 23, 2026
Voting is now live for SGP 1, SGP 2, and SGP 3.
- SGP-0001: The Solana Constitution
- SGP-0002: Double Disinflation
- SGP-0003: Resource and Inclusion Fee
Voting lasts until the end of epoch 1023 (Thursday at approximately 15:30 UTC).
See the…
SGP 1 seeks approval of the Solana Constitution, which would establish a formal framework for network-level decision-making.
The proposal aims to define how the ecosystem handles governance matters and future protocol changes.
SGP 2 focuses on Solana’s token issuance schedule. It proposes increasing the disinflation rate from 15% to 30%, which would cause the network’s inflation rate to decline more quickly.
A faster reduction in inflation could slow the growth of SOL’s supply, although the proposal would not reduce the existing token supply directly.
SGP 3 would revise Solana’s transaction-fee structure by introducing a fixed base inclusion fee paid to the block leader.
It would also add a resource fee based on the transaction’s requested computing resources, with that portion burned.
Together, the proposals could reshape Solana’s governance, issuance schedule and transaction economics.
Institutional demand for Solana strengthened last week as SOL-focused ETFs recorded four consecutive trading days of inflows.
The funds attracted a combined $28.34 million, according to CoinGlass data. This marked their highest weekly inflow total in two months and coincided with Solana’s 27% price rebound.
Sustained ETF inflows could provide additional buying support and strengthen the case for a broader bullish reversal.
However, one week of positive flows does not confirm a lasting trend. Investors will be watching whether institutional demand continues after SOL’s rapid price increase.
Solana faces resistance at $98.41 and $100
The SOL/USD 4-hour chart remains bullish and efficient as Solana is currently trading above the 50-day Exponential Moving Average at $79.04 and the 200-day EMA at $92.67, supporting a positive short-term outlook.
The immediate resistance level is the May 11 high at $98.41, followed by the psychological barrier at $100.
SOL needs a decisive daily close above $100 to confirm a continuation of the recovery.
A successful breakout could open the path toward $112.52, the 127.2% Fibonacci extension of the decline from $98.41 to $60.13.
The 4-hour Relative Strength Index stands near 64, placing SOL close to the overbought territory.
An elevated RSI reflects strong buying momentum but also indicates that the rally may be stretched in the short term.
The Moving Average Convergence Divergence indicator continues to trend higher and maintains a positive histogram, showing that buyers remain in control.
Together, the indicators suggest the broader bias remains bullish, although the risk of profit-taking or consolidation has increased.
On the downside, the 200-day EMA at $92.67 provides immediate support. Holding above this level would preserve SOL’s recent breakout and keep the $100 target within reach.
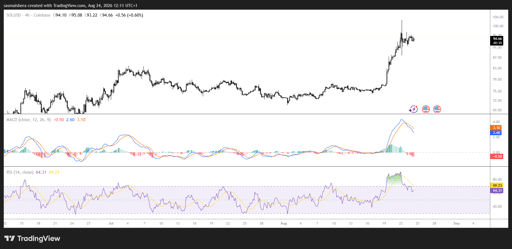
A close below the 200-day EMA could extend the pullback toward the 78.6% Fibonacci retracement level at $88.56.
If selling pressure increases, SOL could fall toward the 50-day EMA at $79.04 and the 50% Fibonacci retracement level at $76.92.
For now, Solana’s outlook remains constructive above $92.67. A confirmed break above $100 would strengthen the bullish case and shift attention toward $112.52.

Top crypto price predictions today: Pi Network, Pepe Coin, Zcash

ADA shorts are piling in: could $0.20 trigger a violent Cardano rebound?

Solana slips as Fed hike bets rise: could $90 become the next battleground?

Trusted Smart Chain: why a transfer agent is the real test of a tokenized security

XRP falls despite ETF inflows: why are buyers still failing to defend $1.40?
No results found
Loading articles...
Failed to load articles. Please try again.