
Bitcoin ETFs keep buying, so why is BTC still stuck below $80K?

AI Sentiment: 68/100 Bullish
This score is generated through AI-driven analysis of the article's content.

powered by

Spot Bitcoin ETFs are still pulling in ~$1.13B net inflows (billion-dollar weeks), while spot demand is rising fastest since late December and spot+futures demand are expanding together. That’s a real demand signal, not just leverage. Buy BTC exposure through US spot Bitcoin ETFs and add on any dip toward ~$78k–$79k while BTC is below the 365-day MA (~$83k). Thesis: sustained institutional/spot buying forces a breakout attempt above $80k and eventually $83k.
Key Risk: Warsh/Jackson Hole turns hawkish and rates jump higher fast, overwhelming ETF inflows and pushing BTC into a deeper selloff below ~$70k.
Use BTC downside into the event: if Warsh signals restrictive policy, BTC typically trades like a high-beta risk asset and can gap lower even with ETF inflows. Sell BTC exposure (short BTC or buy inverse/put protection) specifically into the speech window, targeting a move back toward ~$70k and possibly ~$68.7k–$68.4k if the $83k/weekly breakout fails.
Key Risk: Warsh is dovish or neutral and BTC reclaims $83k quickly, squeezing shorts as ETF inflows continue.
- BTC slips to $79,200 after testing its 50-week SMA at $81,114 earlier this week.
- Spot Bitcoin ETFs attracted $1.13 billion through Thursday amid growing demand.
- Bitcoin could target $87,599 if the weekly candle closes above $81,114.
Bitcoin BTC has been ranging between $78,000 and $80,000 over the past few days.
The leading cryptocurrency by market cap is down by roughly 1% in the last 24 hours and now trades around $79,300 per coin.
The stale performance comes after Bitcoin tested the 50-week Simple Moving Average at $81,114 earlier in the week.
Strong institutional demand has supported the rally, with spot Bitcoin Exchange-Traded Funds heading toward their second consecutive week of billion-dollar inflows.
Despite the improving outlook, Bitcoin remains below its 365-day moving average near $83,000.
Analysts consider a close above this level important for confirming a broader shift into a new bull-market phase.
Bitcoin ETF inflows reach $1.13 billion
Institutional demand has been one of the major forces behind Bitcoin’s latest advance. Data from SoSoValue shows that US spot Bitcoin ETFs recorded $1.13 billion in net inflows between Monday and Thursday.
The funds are now on track to register their second consecutive week of inflows exceeding $1 billion.
The sustained capital entering spot ETFs suggests institutional investors are rebuilding exposure to Bitcoin. Continued inflows could provide additional support for BTC as it attempts to overcome resistance above $80,000.
Institutional demand is also backed by strong retail demand in the market. According to CryptoQuant, Bitcoin’s apparent spot demand is increasing at its fastest monthly rate since late December.
Spot and futures demand are also expanding simultaneously for the first time since early October 2025.
This combination suggests that the rally is supported by activity across multiple sections of the market rather than futures speculation alone.
According to the analysts, demand and liquidity indicators had entered bullish territory. However, Bitcoin must close above its 365-day moving average near $83,000 to confirm the shift.
However, investors are now closely watching Federal Reserve Chair Kevin Warsh’s speech at the Jackson Hole Symposium on Friday for clues about the central bank’s monetary policy outlook.
The address could trigger volatility across Bitcoin and other risk-sensitive assets, particularly if Warsh discusses inflation, economic growth or the direction of interest rates.
A dovish tone or signals that the Fed could lower interest rates would likely support risk appetite and Bitcoin.
Conversely, a hawkish message indicating that monetary policy could remain restrictive may weigh on BTC and the wider crypto market.
The performance over the past few days also comes after the US inflation data provided a mixed macroeconomic backdrop for Bitcoin.
The core Personal Consumption Expenditures Price Index, the Federal Reserve’s preferred inflation measure, remained unchanged at 3.3% year over year in July, according to the US Bureau of Economic Analysis.
The reading matched market expectations. On a monthly basis, both headline and core PCE inflation increased by 0.2%.
Following the report, markets increased their expectations of a September interest rate hike. The CME FedWatch Tool showed the implied probability rising to 40% from 36% before the data was released.
Higher interest rates typically create a challenging environment for Bitcoin by strengthening yields on traditional assets and reducing investors’ appetite for risk.
Bitcoin technical forecast: Will BTC test the 50-week moving average again?
The BTC/USD 4-hour chart remains bearish and efficient despite the recent stale price action. At press time, Bitcoin is trading just slightly above $79,000.
The coin has lost around 2% of its value since it tested the 50-week SMA at $81,114 earlier this week.
If the weekly candle closes on Sunday above this moving average, it could strengthen the bullish outlook and allow BTC to extend its rally toward the next major resistance level at $87,599.
The next target broadly aligns with the 100-week SMA at $89,017, creating a potentially significant resistance zone between approximately $87,600 and $89,000.
While the 4-hour chart shows Bitcoin is consolidating, the daily and weekly charts indicate a bullish scenario.
The 4-hour RSI of 71 means that Bitcoin remains within the overbought level. However, on the weekly chart, the RSI stands at 58, firmly above its neutral level of 50 and indicating that buying momentum continues to improve.
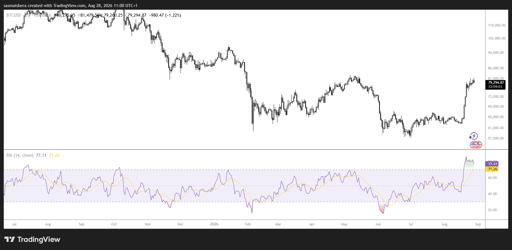
The Moving Average Convergence Divergence indicator also produced a bullish crossover in mid-July. Expanding green histogram bars suggest positive momentum remains intact.
If Bitcoin fails to break above its moving-average resistance and begins a deeper correction, the price could retreat toward the key psychological support at $70,000.
However, buyers would have the opportunity to step in at various support levels, including the 200-day EMA at $72,102.
Failure to defend these support levels could expose lower demand zones at the 50-day and 100-day EMAs at $68,713 and $68,369.

Why XRP traders are watching $1.47 as Evernorth and ETF demand build pressure

ENA explodes 10% as Ethena moves to kill its biggest token overhang

Can Ethereum price reclaim $2,500 as ETF demand battles profit-taking?

Why is Strategy (MSTR) stock gaining 12% today

Bitcoin hits resistance with $2.9B in longs at risk below $68,000
No results found
Loading articles...
Failed to load articles. Please try again.