
Bitcoin’s $82,000 test is coming as one major market signal turns bullish

AI Sentiment: 72/100 Bullish
This score is generated through AI-driven analysis of the article's content.

powered by

Buy exposure to Bitcoin through a US spot Bitcoin ETF (e.g., IBIT or FBTC). The setup is a consolidation with falling volatility, strong spot participation vs pre-breakout, and the clearest historical driver: ETF inflows. The article flags $82,000 as the key resistance; if it breaks, underexposed investors typically chase, and ETF demand has been tightly linked to 30-day BTC gains.
Key Risk: Weekly ETF outflows turn negative and BTC fails to break $82,000, then closes below $72,000.
Sell/short Bitcoin exposure (e.g., BTC futures or a leveraged BTC product) only if price rejects $82,000 and momentum rolls over. The thesis is that lower volatility plus consolidation near major resistance often ends with a sharp mean-reversion move when ETF-driven bids don’t show up. Target the $75,000 support first, then $72,000 if selling accelerates.
Key Risk: BTC cleanly breaks and holds above $82,000, proving the resistance is support and forcing a squeeze higher.
- Bitcoin is consolidating below $77,000 after rallying 23% in two weeks.
- Daily spot volume fell 35% to $3.1B but remains 48% above its pre-breakout average.
- Resistance stands near $82,000, with support levels at $75,000 and $72,000.
Bitcoin entered September in a consolidation phase after gaining approximately 23% over the last two weeks.
The cryptocurrency briefly traded above $81,000 before retreating below $77,000, but analysts say its broader market structure remains relatively healthy.
Bitcoin is trading at $76,990 at the time of writing, down 1.4% over the previous 24 hours.
Bitcoin spot trading volume falls 35%
K33 reported on Tuesday that Bitcoin’s average daily spot trading volume declined 35% over the past week to $3.1 billion.
The drop followed an unusually active period during Bitcoin’s two-week rally. Despite the weekly decline, trading activity remains significantly stronger than it was before the breakout.
Bitcoin rallied 23% and then… basically went sideways.
— K33 Research (@K33Research) September 1, 2026
That’s a healthy follow-up.
Leverage remains subdued, options positioning is balanced, August delivered the strongest monthly BTC ETF inflows since November 2024, and Strategy is buying Bitcoin again.
Latest episode of…
“Despite the sharp decline from last week, volumes remain 48% above the July 1 to August 15 average, as BTC’s new trading range has revitalized spot market activity, bringing both buyers and sellers back into the market,” K33 wrote.
The figures suggest that Bitcoin’s higher price range has renewed participation even as activity cools from the rally’s peak.
Bitcoin’s short-term volatility has also declined as its price consolidates. Seven-day volatility fell to 1.6%, slipping below the yearly median of 1.8%.
The lower reading indicates that Bitcoin’s daily price movements have become less aggressive following the recent surge.
Reduced volatility could allow the market to establish stronger support before its next directional move. However, it may also reflect hesitation among traders as Bitcoin approaches major resistance.
Bitcoin’s relationship with traditional financial assets has shifted considerably. Its 90-day correlation with gold climbed to an all-time high of 0.52. Meanwhile, its correlation with the Nasdaq fell to its lowest level of the year.
K33 said this changing relationship strengthens the argument that Bitcoin may function as a hedge against currency debasement and shifting global liquidity conditions.
The declining connection with technology stocks also suggests that Bitcoin is increasingly responding to a different set of market drivers.
Demand through Bitcoin exchange-traded products remained strong during August. Global Bitcoin ETPs absorbed 52,152 BTC over the month, recording their largest monthly inflow since November 2024.
The increase followed a prolonged period of selling pressure that included record monthly outflows during May and June.
The ETF flows are the clearest driver of Bitcoin’s 30-day returns since the launch of US spot Bitcoin ETFs. The two metrics have maintained a correlation of 0.87.
Bitcoin has also never posted a 30-day gain exceeding 10% without recording net ETF inflows over the same period, according to the firm.
Bitcoin faces key resistance at $82,000
The BTC/USD 4-hour chart has been consolidating over the past few days. Analysts identified $82,000 as Bitcoin’s most important immediate resistance level.
A decisive break above this barrier could extend the recovery and attract additional demand from investors who remain underexposed to the cryptocurrency.
The bullish outlook depends on these investors continuing to buy as Bitcoin approaches resistance.
Bitcoin’s first major support level sits near $75,000, followed by a more important floor at $72,000.
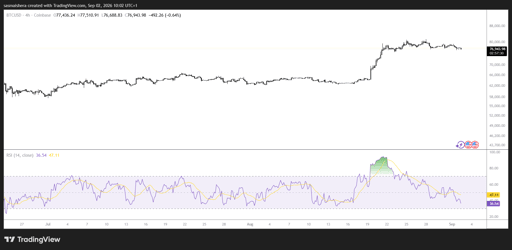
A controlled pullback toward the mid-$70,000 region could benefit the market by removing excessive leverage before another move higher.
For investors looking to stay positioned through Bitcoin’s next phase, comparing crypto apps we recommend could help identify platforms that offer suitable access, security features and trading tools.
However, sustained ETF outflows or a weekly close below $72,000 would weaken the current recovery structure.
Bitcoin’s next major move will likely depend on whether institutional inflows remain positive and buyers can generate enough momentum to clear the $82,000 resistance level.

Ethereum slips toward $2,400: key ETH levels to watch if support breaks

REAL Finance expands European access as $ASSET goes live on Kraken EU

Can ARB price reach $0.14 after 30% rally powered by Robinhood chain?

BONK jumps 7% as rising futures demand supports a breakout attempt

KuCoin upgrades institutional lending program
No results found
Loading articles...
Failed to load articles. Please try again.