
Zcash jumps 51% in a week: is Grayscale’s ETF fuelling a bigger breakout?

AI Sentiment: 78/100 Bullish
This score is generated through AI-driven analysis of the article's content.

powered by

Buy ZCSH. The article shows sustained, fund-driven demand: ~$533m AUM by Sept 8 and >$70m cumulative inflows since launch, with the ETF absorbing ZEC supply. Price action confirms a bullish trend (all EMAs rising; ZEC holding above $1,100) and the market is pressing the $1,250–$1,280 ceiling—if it breaks, momentum can carry quickly toward $1,400 and $1,500.
Key Risk: ETF inflows stall or reverse, forcing the market to sell into the next supply wave and breaking the $1,150 support level.
Buy ZEC on a breakout/hold above $1,280. The setup is stretched but still bullish: parabolic SAR remains below price, Aroon Down is 0% (no meaningful downside trend), and OBV is near highs (buying pressure hasn’t faded). This is the cleanest way to capture a continuation move if the $1,280 resistance finally gives.
Key Risk: A sharp pullback that breaks $1,200 then $1,150, triggering a deeper unwind toward $1,100/$1,000.
- ZEC has gained more than 51% in seven days and is trading near $1,244.
- A break above $1,280 could put $1,400 and $1,500 in focus.
- Daily and short-term indicators continue to favour buyers.
Zcash price has surged more than 51% over the past seven days to trade near $1,244 on Sept. 10, as demand for Grayscale's Zcash ETF continues to absorb ZEC supply.
According to CoinGecko, ZEC has gained 51.3% over the past seven days, 60.3% in 14 days and 153% over the past month.
Zcash climbed from roughly $814 on Sept. 3 to above $1,200 within three days and has since held most of those gains.
The latest move has taken ZEC back towards the $1,250 area after several pullbacks towards $1,100-$1,150 were bought.
Grayscale's Zcash ETF has emerged as the main catalyst behind the week-long rally.
ZCSH, which began trading on NYSE Arca on Aug. 25, had $532.9 million in assets under management as of Sept. 8, according to Grayscale's fund data. The fund held 464,514.8551 ZEC on the same date.
ZCSH reached the $500 million mark just two weeks after its listing.
Grayscale reported more than $70 million in cumulative inflows since launch, while options on the fund began trading on NYSE Arca on Sept. 8.
Part of the fund's assets came from DCG International Investments.
A Sept. 8 filing with the US Securities and Exchange Commission showed that DCG acquired roughly $100 million of ZCSH shares by contributing 85,705.32563297 ZEC through an authorised participant.
Zcash supply held by large investment vehicles extends beyond ZCSH.
Cypherpunk Technologies held 323,394.38 ZEC as of Aug. 18, representing roughly 1.92% of circulating supply, according to the company.
Cypherpunk expanded its Zcash exposure in August through a $33.33 million equity transaction with Winklevoss Capital.
The deal launched a US-based mining operation with 4.2 GSol/s of Equihash computing power, which represented roughly 18% of the Zcash network's hashrate at launch.
The company has set a target of eventually holding 5% of ZEC supply and said roughly 43,800 ZEC are awarded to miners each month.
Short liquidations helped accelerate the first part of the price rally.
ZEC short liquidations reached $13.51 million on Sept. 4 and $27.98 million on Sept. 6 across exchanges tracked by Sharpe Terminal.
The forced closing of short positions required traders to buy back ZEC as the price moved through $1,000 and later $1,200.
ZEC price analysis
ZEC was trading near $1,240 on the daily chart after reaching an intraday high of $1,256.80.
Price has stayed above $1,100 since the latest breakout and is now pressing against the $1,250 to $1,280 area that has capped recent attempts to move higher.
The 20-day exponential moving average has climbed to $963.65, while the 50-day EMA stands at $766.59. The 100-day and 200-day averages are lower at $639.54 and $526.63.
See below:
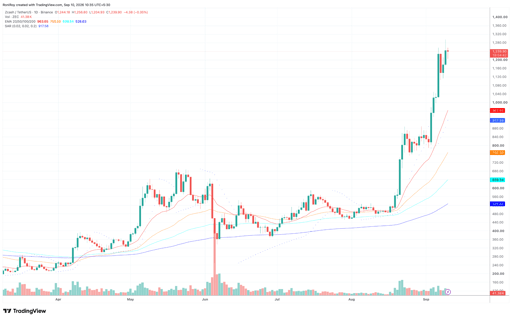
ZEC/USDT 1-day price chart. Source: TradingView.
All four EMAs are rising, with the shorter averages above the longer ones and ZEC trading above each of them.
This alignment shows that the daily trend remains bullish across short, medium and longer time frames.
Price is almost $280 above the 20-day EMA, however, showing how quickly ZEC has moved away from its short-term trend line.
The gap leaves the price stretched after the recent rally and raises the chance of a pullback towards the 20-day EMA if buyers fail to hold the breakout.
Parabolic SAR sits below ZEC at $917.58 and has continued to rise beneath the price.
With the SAR dots still below the market, the indicator continues to favour the uptrend and has not yet produced a bearish reversal signal.
A daily close above $1,280 would take ZEC past its recent highs and could open a move towards $1,400.
If buyers clear that level, $1,500 would be the next major psychological target, roughly 21% above the current price.
On the 4-hour chart, ZEC has been trading close to its highs after the sharp move through $1,000. Aroon Up stands at 71.43%, while Aroon Down is at 0%.
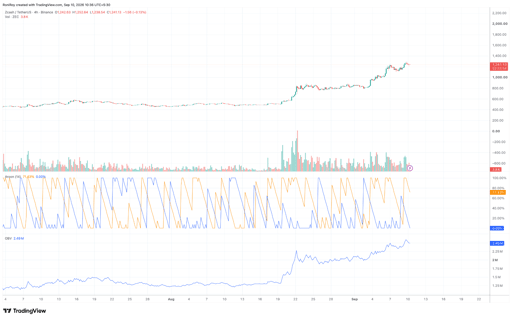
ZEC/USDT 4-hour price chart. Source: TradingView.
The large gap between the two readings shows that the short-term trend still favours buyers, with no recent low strong enough to lift Aroon Down from zero.
Aroon Up has eased from 100% as ZEC moves sideways near $1,240, showing that the upward move has lost some momentum during the consolidation.
A move through $1,280 accompanied by Aroon Up returning towards 100% would show that ZEC is making a fresh high and that short-term momentum is picking up again.
A drop below $1,200 followed by $1,150 would weaken the current price structure.
On-balance volume stands near 2.49 million after climbing sharply during the late-August and early-September breakouts.
OBV remains close to its recent high while ZEC consolidates, showing that the rally has not been followed by a large drop in cumulative buying volume.
If OBV begins falling while ZEC remains below $1,280, it would show selling volume increasing during the consolidation.
For now, price holding near its highs while OBV remains elevated supports another attempt at the $1,250 to $1,280 resistance area.
If ZEC falls below $1,150, price could retest $1,100. Losing that support could send it back towards $1,000, while the rising 20-day EMA at $963.65 sits just below.

Can BitMine’s ETH buying push Ethereum price toward $2,600?

Concordium appoints Geely Sweden Holdings CEO Per Ansgar to Board

USELESS price risks 50% correction after 900% rally

BitMine stakes 85% of its ETH: why $330M barely changes the risk equation

XRP price is flashing a 48% upside setup, but $1.50 must break first
No results found
Loading articles...
Failed to load articles. Please try again.