
VOO & Chill: What's fueling the S&P 500 ETF's relentless run?

AI Sentiment: 82/100 Bullish
This score is generated through AI-driven analysis of the article's content.

powered by

VOO is winning on two fronts: record, persistent inflows (“VOO & Chill”) and still-strong earnings momentum (Q2 >50% growth; Q3 ~30% with upside). The bullish flag on the daily chart plus price staying above key moving averages points to a continuation breakout toward the ~$715 all-time high.
Key Risk: Inflows reverse fast—if “VOO & Chill” sentiment breaks and money rotates out of S&P 500 ETFs, the breakout thesis collapses.
IVV is the closest peer to VOO with similar exposure and fees, yet the article flags IVV running with outflows while VOO takes inflows. That divergence signals relative demand and likely relative performance pressure; sell IVV and rotate into VOO strength.
Key Risk: IVV outflows stop and converge with VOO—if the relative flow gap closes, the relative-performance edge disappears.
- The VOO ETF has added over $131 billion in inflows this year.
- IVV, its top competitor, has had over $41 billion in outflows.
- The fund is benefiting from the popular “VOO & Chill” phenomenon.
The Vanguard S&P 500 ETF (VOO) is firing on all cylinders this year, and is leaving other top competitors behind.
VOO & Chill is driving record inflows
The fund, which tracks the blue-chip S&P 500 Index, has continued adding assets at the fastest pace ever recorded. Data shows that it took six times more than other ETFs in August this year.
VOO added $13 billion in inflows last week, bringing its total year-to-date assets to $131 billion. This means that, if the trend continues, it will surpass the record $137 billion it added last year.
$VOO took in SIX TIMES more than any other ETF in the past month, that is not normal, not to mention +$13b this week despite the latest 'sky is falling' narrative on blast. Now +$131b YTD, a hair away from breaking annual flow record it set last yr of $137b. VOO & CHILL. pic.twitter.com/w03HCX4GPD
— Eric Balchunas (@EricBalchunas) September 11, 2026
It has moved behind of the popular SPDR S&P 500 ETF (SPY) to become the biggest fund in Wall Street. Data shows that it now has over $1.05 trillion in assets under management, while SPY has $810 billion.
Notably, its total inflows this year are much more than other S&P 500 ETFs. For example, the iShares S&P 500 ETF (IVV) has had over $21 billion in outflows this year. This is notable since IVV and VOO are similar funds, even in terms of their expense ratios. SPY, on the other hand, has taken in over $12 billion in inflows this year.
The ongoing surge is driven by the phenomenon known as VOO & Chill. This is a situation where investors move their assets to the fund and hold them for a long time. They believe that beating the S&P 500 Index is one of the toughest approaches in investing. Indeed, most active managers and ETFs often struggle to match the performance of the index.
VOO ETF has some potential catalysts ahead
Looking ahead, there are reasons to believe that the VOO ETF will continue doing well this year. First, earnings growth is still strong. The average earnings growth in the second quarter was over 50%, helped by the AI boom and tariff refunds.
Analysts expect that the third-quarter earnings growth will be close to 30%. In most cases, the real figure is usually much higher than expected, meaning that a 40% or higher growth rate is possible.
Some of the top companies have guided to strong third-quarter earnings growth. For example, Nvidia is expected to make $108 billion this quarter, up by 91% from last year. Similarly, Google’s revenue is expected to come in at $127 billion, up by 25% YoY. Other companies expected to have strong revenue growth are those in the memory industry.
At the same time, it is highly undervalued, trading at a forward price-to-earnings ratio of 19.0, lower than the five-year average of 19.1. Together with the record VOO ETF inflows, chances are that the index will keep doing well.
VOO has formed a bullish flag pattern
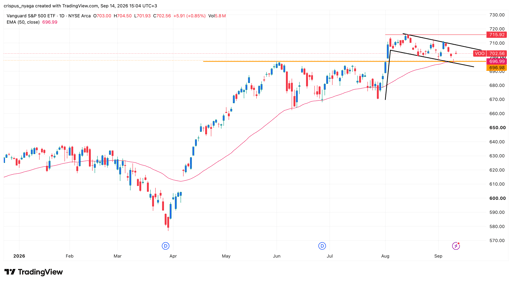
VOO chart | Source: TradingView
The daily chart shows that the VOO ETF has formed a bullish flag pattern. This pattern is made up of a descending channel and a long vertical line. In most cases, it often leads to a strong bullish breakout.
On top of this, the fund has remained above all moving averages. As such, there is a likelihood that it will have a strong bullish breakout, potentially to the all-time high of $715 soon.

Dow opens 153 pts lower as AI selloff and oil surge hit US stocks

IREN, Nebius, CoreWeave: Here’s why these neocloud stocks are falling

Arm stock falls 7% as AI selloff, valuation risks hit chip designer

RUM Group stock jumps on $13.7 billion Anthropic deal: will the gains hold?

These 3 under-the-radar stocks could rally if Fed raises rates this week
No results found
Loading articles...
Failed to load articles. Please try again.