
Intuit stock forecast ahead of earnings: buy, sell, or hold?

AI Sentiment: 62/100 Bullish
This score is generated through AI-driven analysis of the article's content.

powered by

Buy Intuit (INTU). The article flags improving fundamentals (Q3 revenue +10% to $8.6B; consumer growth strong; TurboTax and CreditKarma growing) plus a valuation reset (forward P/E 15.4 vs 5-year avg 33). Technicals also support a continuation move: price above the 50-day MA and ADX rising to 28, signaling strengthening trend. If earnings confirm revenue acceleration and Mailchimp doesn’t worsen, the stock can push toward $400 and then ~$449.
Key Risk: Mailchimp keeps deteriorating and management guidance disappoints, proving AI/competition pressure is worse than the market expects.
Sell/short Intuit (INTU) for a post-earnings technical fade. The stock is near overbought (RSI nearing 70) and the chart risk is a rising-wedge-like setup that can trigger a bearish breakout. If results are merely “okay” (not a clear upside beat), momentum can unwind fast toward ~$300.
Key Risk: Earnings/guidance beat enough to break above $400, forcing momentum buyers back in and invalidating the wedge breakdown.
- Intuit stock has soared by 46% from its lowest level this year.
- The company will publish its earnings this week.
- Technicals are sending mixed signals about the stock.
Intuit stock has jumped in the past few weeks, mirroring the performance of most software companies, as investors buy the dip. INTU jumped to $367, its highest level since May 20th this year, and 46% from the lowest level this year. This rally will be put to the test as the company publishes its financial results.
Intuit to publish earnings amid SaaSpocalypse concerns
Intuit is one of the biggest companies in the software industry, where it provides some of the most popular products. QuickBooks is the biggest accounting software in the world, while CreditKarma is a top player in the credit information industry. It also runs Mailchimp and TurboTax.
Like other software companies, Intuit has come under pressure in the past few months, moving from a record high of $812 in July last year to a low of $253. This retreat happened as investors remained concerned that new AI tools will impact its business.
Intuit’s ongoing rally will face a major test when it publishes its fourth-quarter financial results on Tuesday this week. Its most recent results showed that its revenue rose by 10% in the third quarter to $8.6 billion. This revenue growth was much higher than what analysts were expecting.
Intuit’s consumer revenue rose to $5.3 billion, with TurboTax and CreditKarma growing to $4.4 billion and $631 million, respectively. These numbers show that demand for these solutions continues to grow.
The only major issue facing Intuit is its MailChimp business, which has continued to slow in the past few quarters. This slowdown is partly due to the ongoing AI disruption and competition in the industry.
Analysts expect the upcoming results to show that its revenue growth accelerated last quarter. Its revenue is expected to come in at $4.27 billion, up by 11.43% in the same period last year. If this is accurate, it will bring its annual revenue to $21.3 billion, up by 13.4% YoY. Analysts also expect its next annual revenue to jump by 11.14% to $23.7 billion.
Intuit’s earnings come at a time when its valuation has become a bargain. The forward price-to-earnings ratio moved to 15.4, much lower than the five-year average of 33. The S&P 500 and technology sector multiples are 20 and 23.
Intuit stock price technical analysis
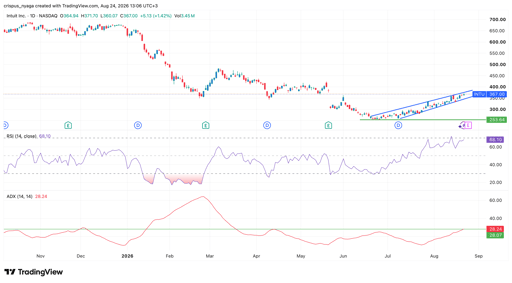
INTU stock chart | Source: TradingView
The daily chart shows that the INTU stock has jumped in the past few weeks, moving from the year-to-date low of $253 in July to $367. This rebound accelerated after Atlassian announced encouraging results and after the recent rumors of Workday acquisition.
The stock has moved above the 50-day moving average, while the Average Directional Index (ADX) moved to 28, its highest level since March 26, a sign that the momentum is accelerating.
The Relative Strength Index (RSI) has continued rising and is nearing the overbought level of 70. A soaring RSI indicator is a sign that the momentum is rising.
The risk, however, is that it has formed a pattern resembling a rising wedge pattern, which may lead to a bearish breakout. If this happens, it may drop to $300. On the other hand, the alternative scenario is where it moves to $400. A move above that level will point to more gains towards $449, the average estimate among analysts.

How will private credit and equity stocks react to Fed rate hikes?

WTI crude oil price forecast as Middle East risks remain elevated: can it hit $120?

Top crypto price predictions today: Pi Network, Pepe Coin, Zcash

Why SpaceX stock is up around 1% on Friday

Analyst: Adobe stock's post-earnings dip isn't about AI disruption fears only
No results found
Loading articles...
Failed to load articles. Please try again.