
Prévision AAVE : les haussiers visent $125, la rupture du drapeau haussier approche

Sentiment IA : 72/100 Haussier
Ce score est généré à partir d’une analyse par IA du contenu de l’article.

propulsé par

Acheter AAVE. Il reste au-dessus des MME à 10/20/50/100 jours et pousse sur la zone de résistance $100–$105 ; une clôture journalière au-dessus d'environ $97.9 renforcerait la tendance haussière et préparerait une poussée vers $105, puis $125. Le volume est en baisse, donc le mouvement devrait être vif dès le retour des acheteurs. Niveaux clés : reprendre $105 pour viser $125 ; la mesure du drapeau haussier projette une cible plus élevée si $105 est franchi.
Risque clé : AAVE échoue à reprendre $105 et casse sous environ $94.6 à la clôture journalière, déclenchant une chute rapide vers $93.8/$92.4.
Acheter AAVE uniquement sur confirmation : entrer après une rupture décisive au-dessus de $105 (et non une simple mèche). Cela s'aligne avec la thèse du drapeau haussier sur une unité de temps supérieure ; si $105 tient, la mesure du mouvement projette vers ~$141. Le scénario est plus propre car il élimine le risque de « fausse rupture » autour de la zone $100–$105.
Risque clé : La rupture au-dessus de $105 se retourne rapidement sous $105 et le drapeau haussier échoue, renvoyant le prix vers la zone de demande des $90.
- AAVE must clear $100-$105 to confirm a bullish breakout.
- Michaël van de Poppe targets $125 after breakout confirmation.
- Crypto Patel's bull flag pattern projects a move toward $141.
AAVE is trading just below one of its most important resistance zones of the year, with technical indicators and market structure pointing to a decisive move ahead.
While the token slipped 1.6% over the past 24 hours to trade around $94.35, the broader trend remains intact after a 22.8% gain over the last 30 days.
The latest price action has shifted attention to the $100-$105 region, where several analysts believe the next major trend will be decided.
AAVE approaches key breakout zone after strong monthly recovery
Despite the latest pullback, AAVE has continued to build a series of higher lows, a pattern that often reflects steady buying interest.
Over the past week, the token gained more than 4%, even as the broader cryptocurrency market struggled with risk-off sentiment.
The recent decline appears to have been driven largely by market-wide weakness rather than protocol-specific developments.
Bitcoin also traded lower during the same period, while the total crypto market lost roughly 1.3%, weighing on large-cap altcoins including AAVE.
At the same time, AAVE's trading volume dropped by more than 25% to approximately $169.5 million, indicating that buyers have yet to return aggressively.
The crypto market's Fear & Greed Index remained at 35, reflecting a cautious environment that has limited momentum across digital assets.
From a technical perspective, AAVE continues to hold above its 10-day, 20-day, 50-day, and 100-day exponential moving averages (EMAs), maintaining a bullish short- to medium-term structure.
The only major trend barrier still overhead is the 200-day moving average, which sits close to the broader $105 resistance area.
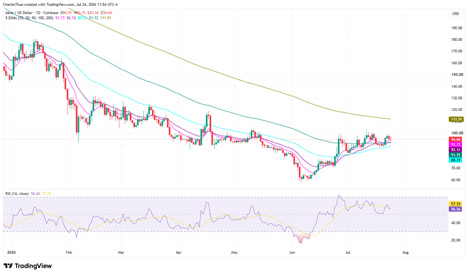
Momentum indicators also remain balanced. The 14-day Relative Strength Index (RSI) stands at 56.26, a neutral reading that suggests the market is waiting for a fresh catalyst before committing to the next directional move.
$100 and $105 remain the levels to watch
Price action over the coming sessions is likely to revolve around a relatively narrow trading range.
The first resistance sits at $97.92. A daily close above that level would strengthen the current uptrend and open the door for a test of the psychological $100 mark.
Beyond that, the next important resistance stands near $100.65, followed by the longer-term barrier around $105.
On the downside, immediate support is located around $94.60, which has become an important level because of concentrated liquidation activity.
If buyers fail to defend that area, price could quickly revisit the next liquidity zone near $93.80.
A stronger support level sits at $92.44. Losing that level on a daily closing basis would weaken the current bullish structure and increase the probability of a deeper retracement toward the $90 demand zone.
Analysts outline targets of $125 and $141
Several well-known crypto analysts are focusing on the same breakout levels despite having different upside targets.
Michaël van de Poppe recently said AAVE appears "primed for a strong breakout upwards," pointing to the formation of consistent higher lows beneath resistance.
According to Michaël’s analysis, continued demand below resistance increases the probability of an upside move, with $125 serving as his next major target if the breakout is confirmed.
$AAVE is looking primed for a strong breakout upwards.
— Michaël van de Poppe (@CryptoMichNL) July 24, 2026
The reason for this is relatively simple; constant higher lows and demand propping up price before there's a breakout above the resistance.
What are the next target zones?
For me it's $125. pic.twitter.com/JfuLJvRNf2
Crypto Patel also maintains a bullish outlook but approaches the chart from a different perspective.
He believes AAVE continues to respect a higher-timeframe bull flag that developed after the token rebounded from channel support near $88.
According to Patel, the pattern would only be confirmed after a decisive breakout above $105. If that happens, the measured move from the bull flag projects a potential advance toward $141.
However, Patel also notes that failure to reclaim $105 could send the token back toward the $90 demand zone before the next major move develops.
$AAVE Is One Breakout Away From a Massive Move$AAVE continues to respect its bull flag after a strong bounce from channel support near $88.
— Crypto Patel (@CryptoPatel) July 22, 2026
Now all eyes are on $105.
A confirmed HTF breakout above $105 would validate the pattern and project a move toward $141.
Failure to… pic.twitter.com/eRihh9POtG
Although the upside targets differ, both analysts identify the same technical area as the point where bullish momentum would gain stronger confirmation.

TxFlow L1 renforce son infrastructure avec un audit d'OpenZeppelin

Cours de Robinhood bondit de 11% grâce au rallye du BTC : HOOD peut-il conserver ses gains ?

Taux du Trésor à 30 ans : pourquoi ils vont s'envoler malgré l'action de Bessent

Le Dow recule, l'optimisme autour de l'IA soutient les technos et le pétrole grimpe

L'ETF SCHD atteint un record : pourquoi DIVB est un meilleur achat
Aucun résultat trouvé
Chargement des articles...
Failed to load articles. Please try again.