
Crypto price prediction: Shiba Inu, Pepe coin, and XRP
- Shiba Inu price has formed a giant double-bottom chart pattern.
- Pepe coin has formed an inverse head and shoulders pattern.
- XRP price has found substantial resistance at the 50-day moving average.
Meme coins remained under pressure this month as market participants watched the ongoing trade war between the US and China. Bitcoin price was trading at $84,000 on Monday, while the market cap of all coins remained at $2.7 trillion. This article looks at three key crypto tokens: Shiba Inu (SHIB), Pepe coin (PEPE), and Ripple (XRP).
Shiba Inu price prediction
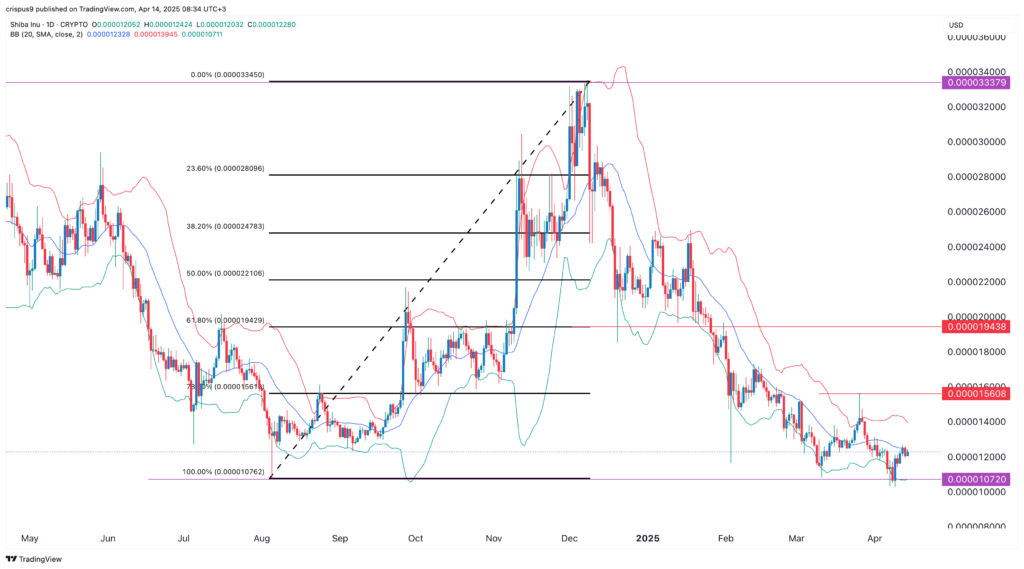
Copy link to sectionSHIB price has been in a strong bearish trend in the past few months as the crypto market imploded. It dropped from a high of $0.00003337b in December last year to the current $0.00001232.
The daily chart shows that the SHIB price bottomed at $0.00001072, a crucial level since it was also its lowest swing in August last year. That is a sign that the token has formed a giant double-bottom pattern, a popular bullish reversal sign whose neckline is at $0.00003335, up by 170% from the current level.
Shiba Inu price has also formed a small double-bottom pattern, its lowest swing on March 11 and April 9. The neckline of this pattern is at $0.00001560. Therefore, there is a likelihood that the token will bounce back in the next few days, with the next point to watch being at $0.00001560, up by over 26% from the current level.
A break above the double-top’s neckline at $0.00001560 will point to further gains, potentially to the 61.8% retracement point at $0.00001943, up by over 60% from the current level. The bullish view will be invalidated if the price drops below the key support at $0.00001072 will invalidate the bullish outlook.
Read more: Shiba Inu price prediction: mapping out potential SHIB scenarios
Pepe coin price analysis
Copy link to section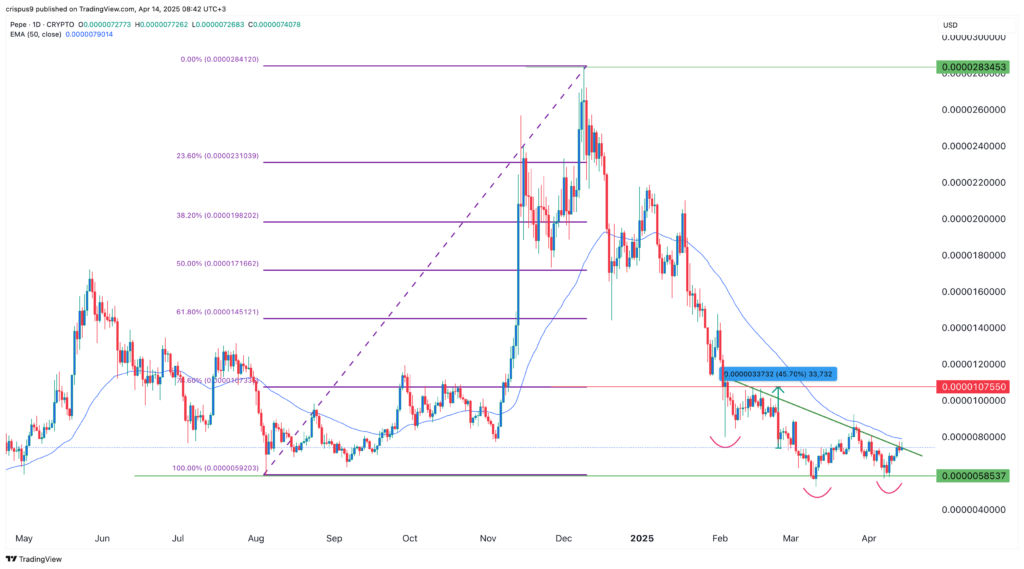
The daily chart reveals that the value of Pepe has crashed in the past few months, moving from a high of $0.00002835 in December to the current $0.00000745. It bottomed at the key support at $0.000005853, its lowest point in August last year, March 11, and April 7. That is a sign that the coin has formed a triple-bottom pattern, a popular bullish sign in the market.
Pepe coin prices have also formed an inverted head-and-shoulders pattern, a popular bullish signal in the market. An inverse H&S pattern is made up of a head, two shoulders, and a slanted neckline.
Pepe price is attempting to move above the neckline and the 50-day moving average. Therefore,a break above the neckline and will point to more gains, with the next point to watch being at $0.00001075, the 23.6% retracement point, which is about 45% above the current level.
XRP price technical analysis
Copy link to section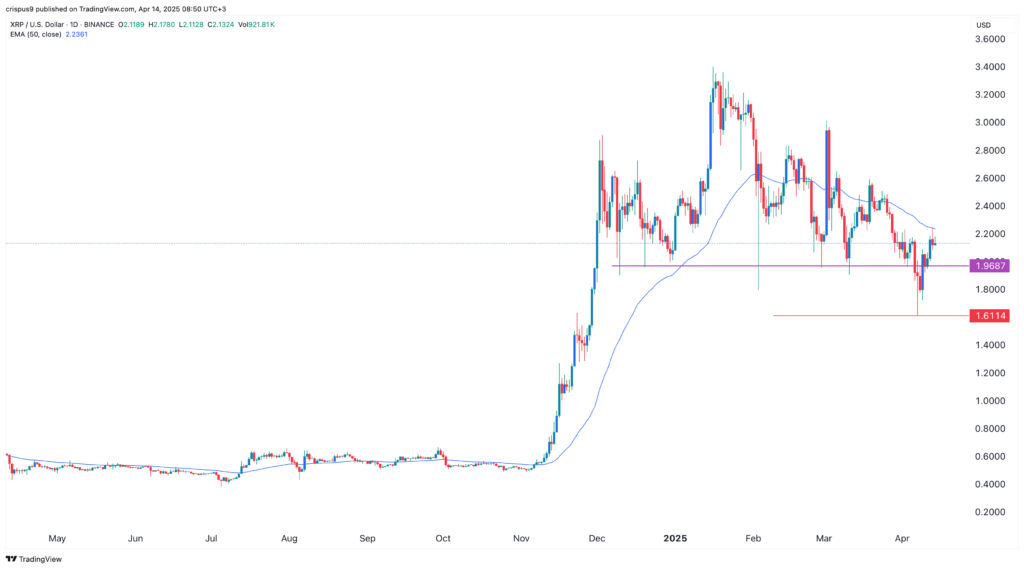
XRP token price has bounced back in the past few days, moving from a low of $1.6115 to a high of $2.1325. It has moved slightly above the key resistance point at $1.9687, the neckline of the head and shoulders pattern.
XRP has found substantial resistance at the 50-day moving average. It needs to move above that level to validate the ongoing rebound. Most importantly, Ripple must surge above the shoulders section at $3.4 to invalidate the bearish outlook of the head and shoulders pattern.
Therefore, there is a likelihood that the XRP price will retreat in the coming days and potentially retest the support at $1.9687. A drop below that level will point to more downside, with the next point to watch being at $1.6115.
Read more: XRP price prediction: the next Ripple target after losing key support