USD/SGD bearish trend intact after strong Singapore GDP data
- The USD/SGD pair declined sharply after the latest Singapore GDP data.
- The economy expanded by 13.1% in Q1 even as the pandemic continued.
- The data came a day after it published strong inflation numbers.
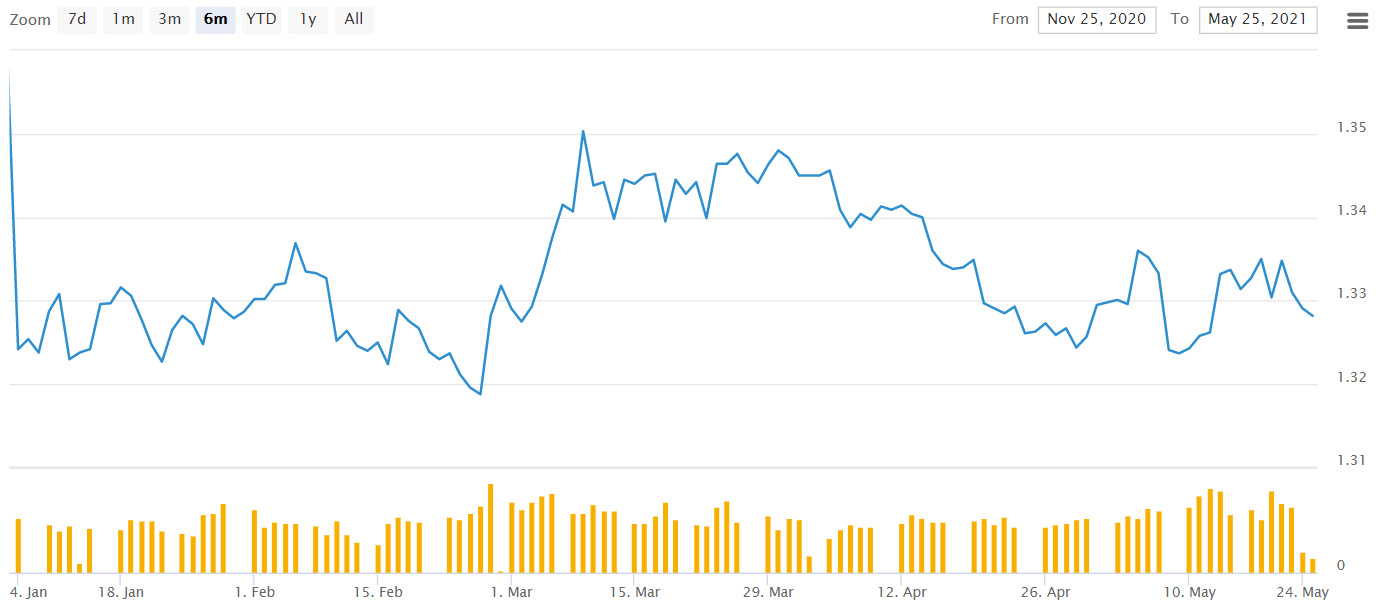
The USD/SGD price retreated after the relatively strong inflation and GDP data from Singapore. It is trading at 1.3272, which is the lowest it has been since May 12 this year.
Singapore GDP data
Copy link to sectionThe Singaporean economy rebounded in the first quarter even as the country battled the coronavirus pandemic. According to the statistics agency, the country’s GDP expanded by 13.1% in the first quarter after it rose by 2.0% in the previous quarter. This led to a year-on-year gain of 1.3%, which was better than the expected 0.9%. It was also the fastest growth rate in the past year.
Data by the ministry showed that manufacturing expanded by 10.7% year-on-year while the construction sector contracted by 22.7%. Both public and private sector construction declined. At the same time, the services-producing sectors shrank by 4.7% after shrinking by 4.7% in the previous quarter. In a note, analysts at Bloomberg said:
“We are sticking with our forecast of 5.8% growth this year, especially with vaccinations progressing swiftly.”
The USD/SGD is also rising after the relatively strong Singapore inflation data. In a report published on Monday, the statistics agency revealed that the overall headline consumer price index rose to 2.1% year-on-year after rising by 1.3% in March. This was better than the median estimate of 1.9%. The core CPI that excludes the volatile food and energy prices rose by 0.6% from 0.5%.
In a note after the inflation data, analysts at ING said that the Monetary Authority of Singapore (MAS) will not react by hiking or lowering interest rates. The analysts expect inflation to hover around 2% through August and then ease to 1.5% by end of the year. Later today, the USD/SGD will react to the US house price index and new home sales numbers.
USD/SGD technical analysis
Copy link to section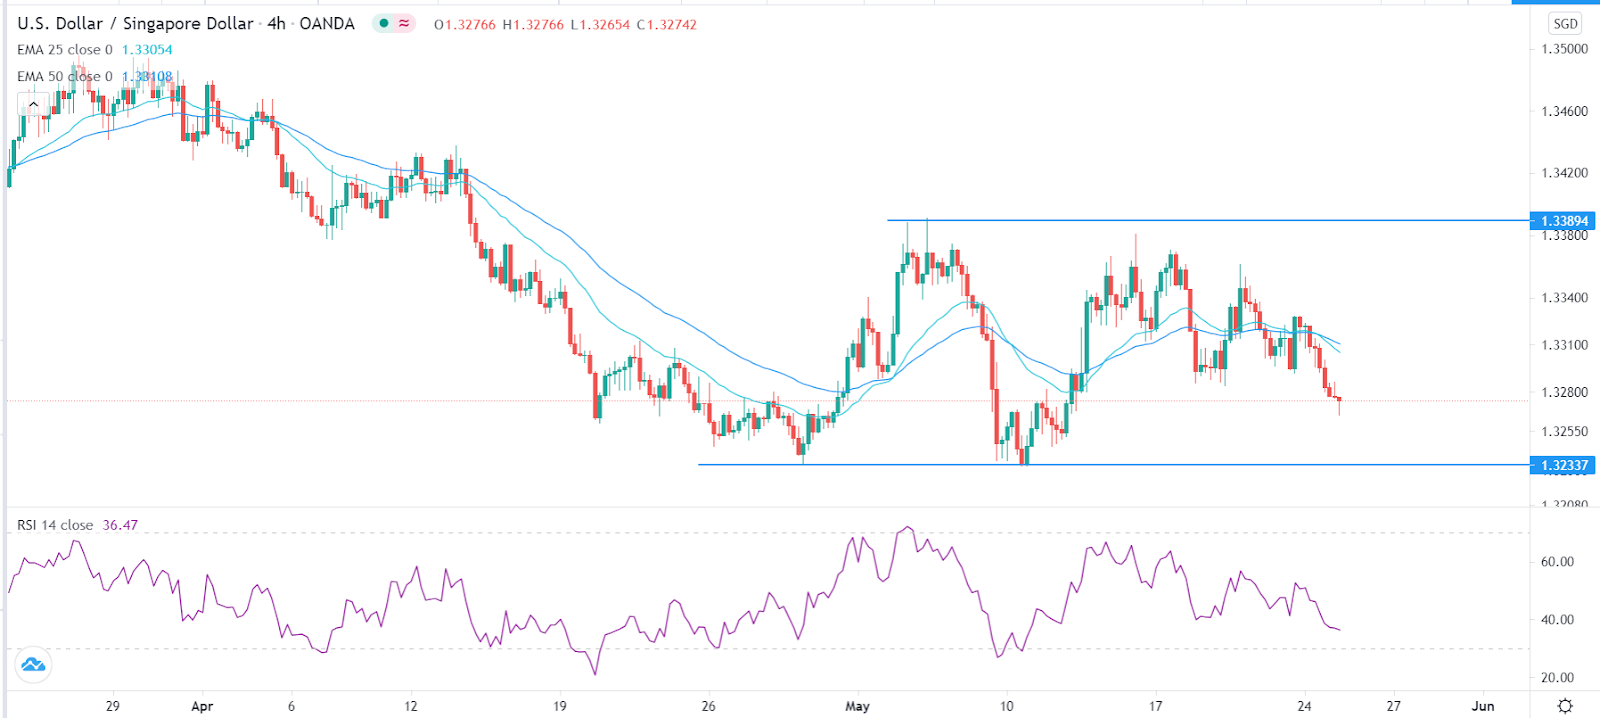
The four-hour chart shows that the USD/SGD pair declined to 1.3273 after the latest Singapore GDP data. This price is slightly below the 25-day and 50-day exponential moving averages (EMA). It is also lower than the double-top pattern at around 1.3390. The Relative Strength Index (RSI) has also declined to 36. It has also moved below the double top’s neckline at 1.3285. Therefore, the pair will likely keep falling as bears target the next key support at 1.3233.
More industry news