U.S. Core CPI Slows Down in July – Used Vehicles Prices Cooled Off
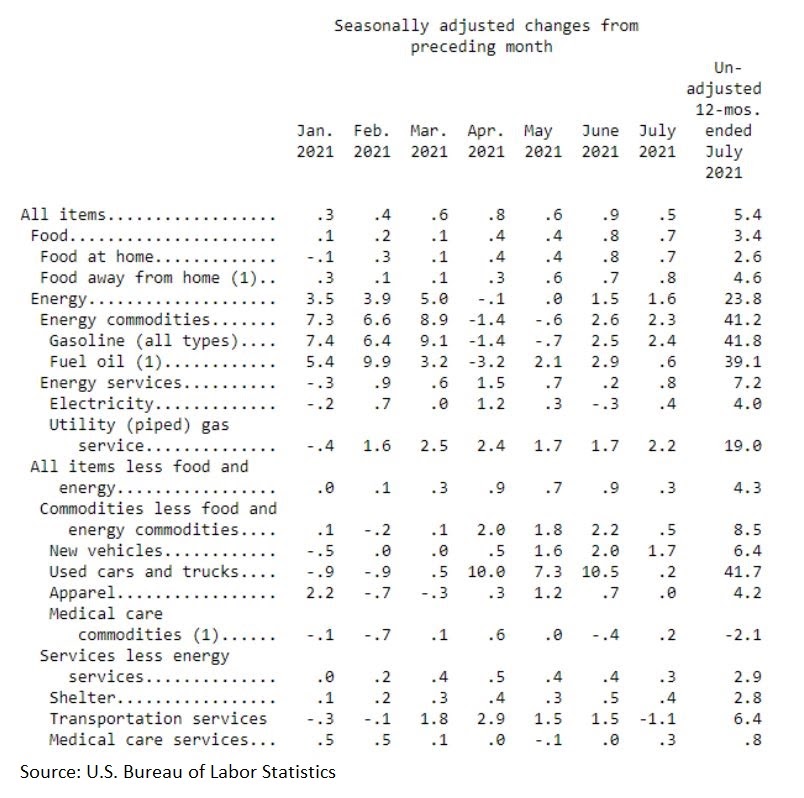
U.S. July inflation moderates in July. While still elevated, the headline rate slows down to 0.5% from 0.9% and remains unchanged at +5.4% YoY.
Every currency trader has been waiting for the release of the U.S. inflation this week. Before the data was out yesterday, the price action in the currency market was typical for summer trading – a waiting game until the release.
Inflation in July moderated while remaining elevated. Investors feared that the inflation rate might accelerate further, but it came out unchanged on the year at +5.4%. This is still way above the previous Fed’s target of 2% but in line with the new Fed’s definition of price stability of averaging 2% over a certain period.
The Fed made clear that it is willing to let inflation overshoot for a while. The idea behind this is that inflation is transitory and that the economy still needs support as it recovers from the COVID-19 pandemic.
Besides the headline inflation, the core data, the ones that exclude the prices of food and energy, came out weaker than expected in July. The market participants expected it at 0.4% on the month, but it slowed to 0.3% – nevertheless, an increase, albeit not as feared.
Will the Fed Keep Its Nerve?
Copy link to sectionEnergy and new vehicles prices increased the most in July, while used car and truck prices cooled off compared to the previous months. Also, shelter prices (i.e., rent) remain elevated, and they may trigger further upside in the inflation rate, especially if the prices of new home sales keep their rising trend.
Even with inflation cooling off, it is still on the rising path. The Consumer Price Index (CPI) is a basket of goods and services that does not comprise all the prices in an economy. Therefore, consumers may still see even higher inflation in some other parts.
For example, Tyson Foods, the world’s second-largest meat processor, has just announced this week that it is increasing its meat prices by 39%. The reason is the rise in costs and inflation.
But, if the core data does not consider the prices of food, such changes in prices will not appear in the official data. Yet, we all need food to make it from one day to another.
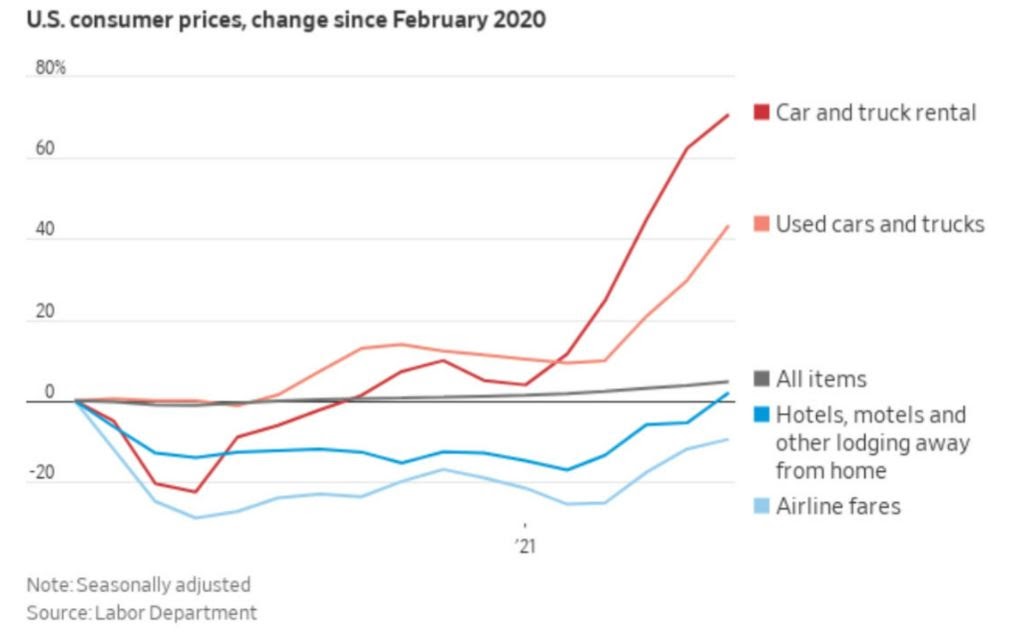
Perhaps the best chart to explain the Fed’s “transitory inflation” mantra is the one above. It shows the U.S. consumer prices since February 2020, when the COVID-19 pandemic started. All items are mostly unchanged, despite some huge deviations for car and truck rentals and used cars and trucks sales.
After yesterday’s release, the U.S. dollar took a hit across the board, albeit a moderate one. Also, the stock market indices made new record highs, liberated by the rising inflation fears.

More industry news