ETF chart of the week: Vanguard Growth (VUG) outlook as inflows rise
- The VUG ETF has added over $8.4 billion this year.
- It has done well because of the ongoing technology rally.
- The fund will be in the spotlight as top companies like Microsoft, Amazon, and Meta publish their earnings.
The Vanguard Growth ETF (VUG) stock price has retreated sharply in the past few weeks as concerns about earnings and valuations continued. It slumped to a low of $355.6 on Thursday, down by 9.37% from its highest point this year.
The Vanguard Growth Fund is a popular ETF
Copy link to sectionThe VUG ETF is a popular ETF that tracks the performance of the CRSP US Large Cap Growth Index, which is made up of 188 companies in the US.
Its portfolio is made up of the biggest technology companies that are showing strong growth rates. Data shows that these firms have an average earnings growth rate of 22.3% and return on equity metric of 41.8%.
Its P/E ratio stands at 39.3, making it substantially overvalued. Its price-to-book ratio stands at 11.3x, higher than the S&P 500 average of 4.3.
The fund holds all types of companies, with technology ones having a 60% stake. Its other top constituents are companies in consumer discretionary, energy, financials, healthcare, and industrials.
The biggest companies in the fund are similar to those in the S&P 500 index. Microsoft is its biggest constituent company, accounting for 13% of the fund. It is followed by Apple (12%), Nvidia (11.3%), and Amazon.
The other big non-tech companies in the VUG ETF are Eli Lilly, Costco Wholesale, Linde, a large chemicals company, S&P Global, TJX Cos, and Vertex Pharmaceuticals.
VUG performance
Copy link to sectionThe Vanguard Growth Fund has done well over the years because of its bias towards technology companies. Its total return this year stands at 20.5%, higher than the benchmark 17.60%.
It returned 46.83% in 2023, beating the category segment’s growth of 36.74%. Its other top year was in 2020 when the ETF rose by 40.2%, higher than the category performance of 35.8%. A year earlier in 2019, the fund was up by 37%.
As shown below, the VUG ETF has outperformed the SPDR S&P 500 (SPY) and the Invesco QQQ (QQQ) fund in the last 12 months. It rose by 26% in this period while the QQQ and SPY jumped by 23.48% and 21.2%, respectively.
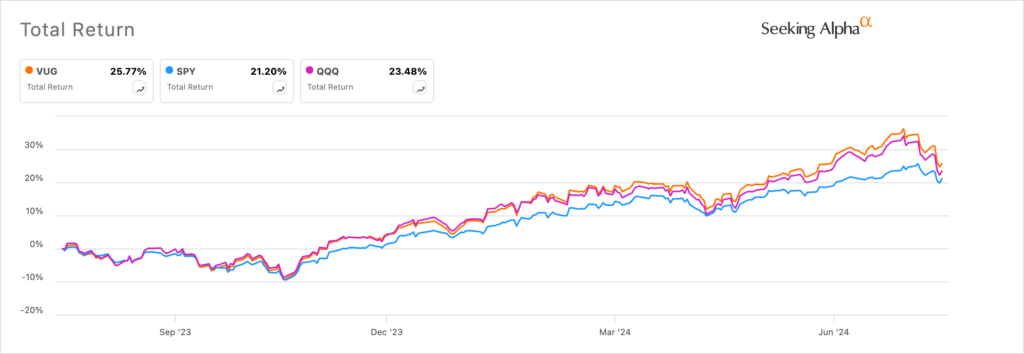
VUG vs SPY vs QQQ: Source: SeekingAlpha
The fund has beaten the SPY ETF in the past five years as it soared by 120% vs SPY’s 95%. It has trailed below the QQQ fund, which has grown by 145% in this period.
This performance is because the fund has a deeper bias towards tech companies that have thrived in the past few decades.
However, the biggest risk is what would happen if technology stocks loses momentum and plunges. Besides, some of its top companies are highly overvalued. Nvidia has a forward price-to-earnings ratio of 43, higher than the sector median of 29.
The other notable thing is that the fund has been one of the top funds in terms of inflows. It has added over $8.4 billion this year, making it the 10th biggest ones. The fund has been beaten by the likes of DYNF, FBTC, VOO, and IVV.
Top earnings ahead
Copy link to sectionThe next two weeks will be important for the VUG and other tech-focused ETFs as some of the biggest constituent companies publish their financial results.
Data by Factset shows that 41% of all companies in the S&P 500 index have published their financial results. 78% of these firms have published positive EPS figure, with the forward S&P 500 growth being at 9.8%. If this is the final figure, it will be the fastest growth rate since 2021.
Microsoft, AMD, and S&P Global will publish their financial results on Tuesday while Meta Platforms, Mastercard, and Arm Holdings will release their numbers on Wednesday.
After that, Apple, Amazon, Intel, Vertex Pharmaceuticals, and Booking Holdings wil release their numbers on Thursday. As such, Microsoft and Apple, which account for over 22% of the fund will publish their data this week. As such, if either of them drops, there are chances that the fund will also drop.
VUG ETF analysis
Copy link to section
VUG ETF chart: Source: TradingView
The daily chart shows that the VUG ETF stock peaked at $392 in July and then neared moving into correction as it dropped to $355. It has found a strong support level at the 100-day Exponential Moving Average (EMA) and the 23.6% Fibonacci Retracement point.
The VUG stock has also moved below the 50-day moving average. It has formed a morning star pattern. Therefore, the outlook for the stock is bullish, with the next point to watch being at $375. A move above that level will lead to more upside as buyers target the key resistance at $385.
On the other hand, a drop below the key support at $355.67 will point to more downside as sellers target the psychological point at $350.
More industry news