TLT: The case against the iShares 20+ Year Treasury Bond ETF
- The TLT ETF has slumped by over 40% from its all-time high.
- There are concerns about the soaring US public debt.
- The yield curve has inverted for over 600 days, a record.
The iShares 20+ Year Treasury Bond ETF (TLT) has come under pressure in the past few years as concerns about the US public debt have remained. Its stock has plunged by over 40% from its all-time high of $162.97 to the current $90. It is also hovering near its lowest level since September 2014.
Soaring debt and Federal Reserve actions
Copy link to sectionThe TLT ETF is one of the biggest funds in the bond market with over $45 billion in assets under management. It tracks an index made up of long-term government bonds, which have come under substantial strain over the years.
The biggest challenge for the fund is that the US debt is growing at an unprecedented level while its historical buyers have started scaling back their purchases. Recent data shows that the total debt has soared to over $34.6 trillion and the figure is growing by $1 trillion every 115 days.
Worse, the US has lost its Triple A credit rating from Fitch and Moody’s could be next if the ongoing spending craze in Washington continues. Most importantly, no political party is focused on slowing the deficit spending.
Biden has committed to spending more money on green energy and wars while Trump is campaigning on more tax cuts. The Congressional Budget Office (CBO) has warned that Trump’s tax proposals will lead to a $4 trillion deficit increase in a decade. Some analysts believe that the US could go through an event like the UK’s mini-budget meltdown when it increases its deficit through unfunded tax cuts.
It is also worth noting that the global economy is going through major changes. BRICS has expanded to include more countries like Saudi Arabia and Iran while the safety of the US dollar is in question. This explains why the price of gold has surged to a record high.
The rising US public debt has also triggered the longest yield curve inversion ever. A yield curve inverts when investors are charging higher interest on short-term government bonds than the longer ones. At press time, the two-year Treasuries were yielding 4.97% while the 30-year was yielding 4.67%. A 3-month note has a yield of about 5.23%.
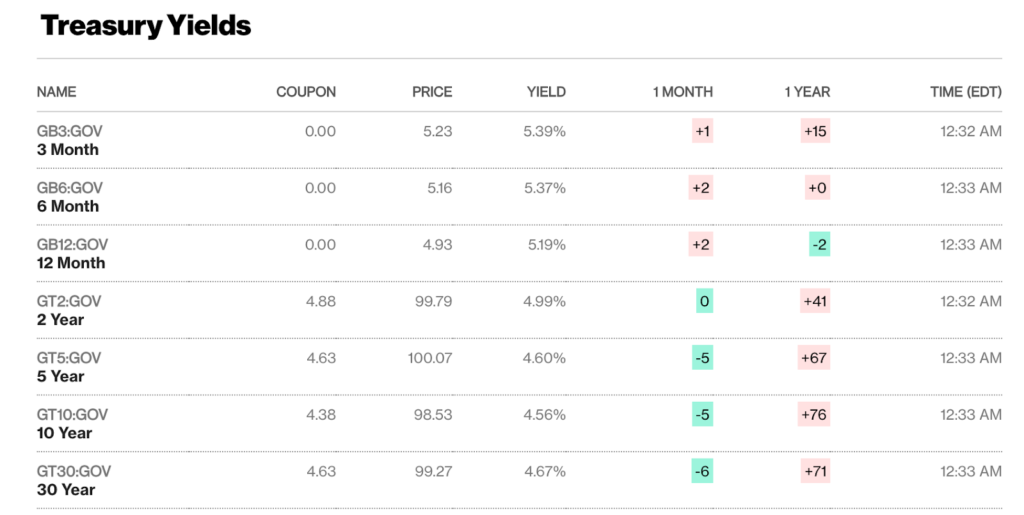
US Treasury Yields
Looking forward, there are concerns about the next actions by the Federal Reserve since the US is going through stagflation. The economic growth slowed to 1.6% in the first quarter after expanding by 3.4% in Q4. Recent retail sales, manufacturing production, and housing numbers have pointed towards more slowdown.
At the same time, inflation has remained stubbornly high in the past few months. The headline and core Consumer Price Index (CPI) have remained above 3% this year. As a result, Fed rate cuts could trigger more inflation.
TLT ETF technical analysis
Copy link to section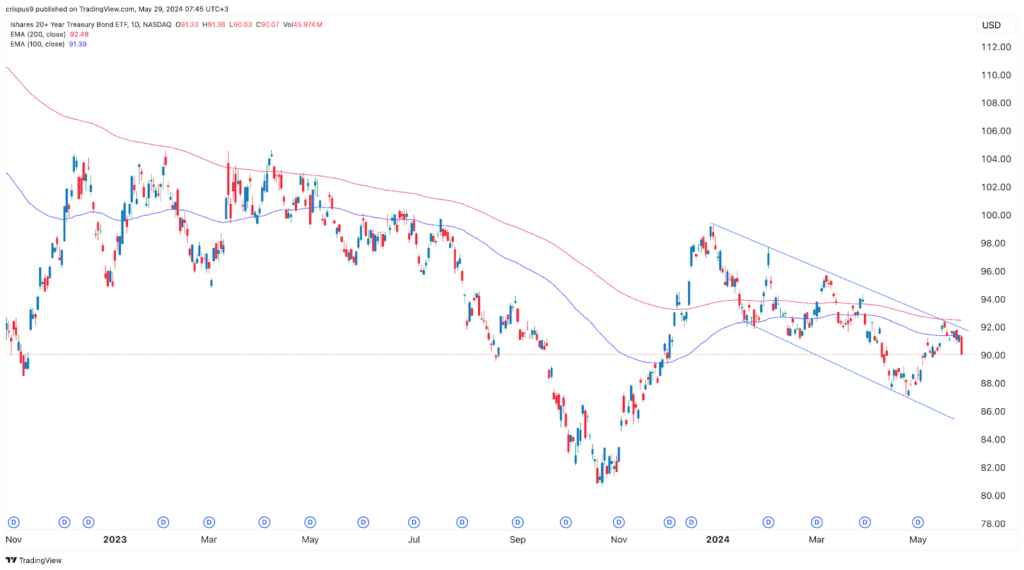
The daily chart shows that the iShares 20+ Year Treasury Bond ETF has been in a downward trend for a while now. It has formed a descending channel shown in blue. Its current price is a few points below the upper side of this channel.
Also, the fund has constantly remained below the 100-day and 200-day Exponential Moving Averages (EMA). Therefore, I suspect that the ETF will continue falling as sellers target the lower side of the channel at about $85.
More industry news